Unlocking the Foreclosure Box – The Most Comprehensive Shadow Inventory Housing Analysis for Los Angeles County. Examining 269 Zip Codes and Finding 100,000 Shadow Properties while Public Views 19,000.
One resolution I had coming into 2010 was getting a better number for the shadow inventory in Southern California. It is rather clear that shadow inventory is a real factor in the current market but how big is this inventory? Can we really get an accurate figure for a large area like Los Angeles County? Well this is something I set out to do. The trouble with the current numbers is they are derived from a variety of sources. First, you need to pull MLS data for each of the 269 zip codes in Los Angeles County. This is the largest county in California with approximately 9,700,000 people living here. It provides an excellent cross section of all the ills California housing is currently experiencing. If we can get a handle on the actual shadow inventory for this area we can put together a better picture of the housing market for 2010.
The California housing market for 2010 is going to deal with the heavy flow of Alt-A and option ARM products hitting in conjunction with prime mortgages that are no longer able to remain current in this troubled economy. Let us first define shadow inventory at least how we perceive it. Some narrowly define shadow inventory as REO properties that are not on the MLS. This definition is wrong and too limited because it misses the bigger piece of the pie. That piece includes homes scheduled for auction and homes with a notice of default filed (NOD) that have yet to make it onto the MLS. Some argue that these homes are not shadow inventory because there is a chance they will become current and have no need of being on the MLS for sale. This is misguided because only 3 to 5 percent of these mortgages will be cured so the bulk will eventually end up as foreclosures and will get on the MLS at some point. This is what we can measure. Yet I would also argue that there is another layer of homes that are currently 90+ days late that have no NOD filed and these are also part of the shadow inventory.
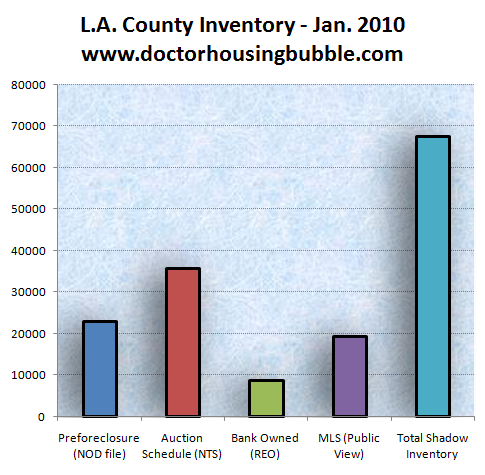
I painstakingly over a few days pulled data on all 269 zip codes for Los Angeles County to get a better picture of what is really going on. Data was pulled from a variety of sources including the MLS, foreclosure filings, and DataQuick to name a few. Putting this together gives us a fascinating picture:
Here is the real story. The purple column is the MLS viewable data by the public. According to this data L.A. County as of the start of 2010 has approximately 19,400 homes. In November 6,257 homes sold in the county. This gives us some 3 months of inventory (a healthy amount). Yet that is probably where the normalcy ends. Let us go through each column. First, we have more homes in pre-foreclosure than the entire MLS data. These are homes that now have a notice of default filed. Next, we have homes that have an auction scheduled. These homes are deeper in the foreclosure process. This number is enormous and by itself is almost twice the size of the MLS data. Next, we have bank owned homes that is usually what some look at when they define shadow inventory. It becomes clear why some like to skew the data. Banks are lagging and when you only look at REOs, then it doesn’t look so bad. Yet this assumption falsely sits with the notion that the NOD and auction column are somehow going to miraculously cure with some programs like HAMP. Yet the data on HAMP is proving otherwise with roughly 4 percent of trial modifications becoming permanent. Add the shadow data columns up and you get a hidden inventory that is nearly 3 times the MLS data. The difference is 3 months of inventory versus nearly 14 months of inventory.
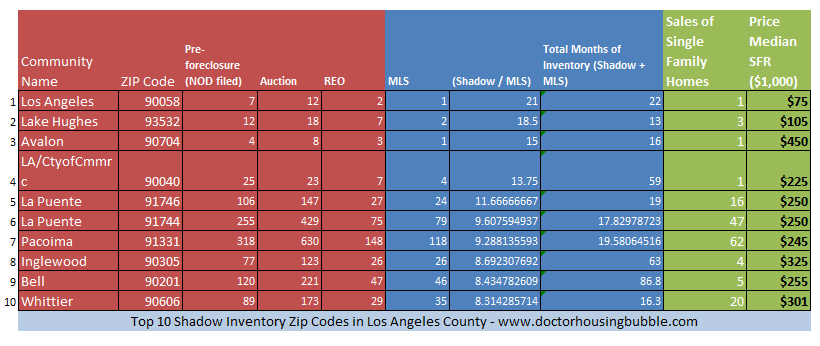
What does this mean? There is a tremendous amount of property in distress. Until this calms down the market is going to remain highly volatile. I also wanted to look at which zip codes had the largest number of shadow inventory in relation to the MLS data. As you would expect, more troubled areas have a larger number of shadow inventory but you’ll be surprised how many zip codes have more shadow inventory than MLS data:
Now this data is fascinating. Let us dig around the data to help explain what is going on. First, you’ll notice that the top 10 shadow inventory zip codes all fall around $300,000 except for one area. This would be expected since many of these areas are the most troubled. Let us use one of the examples above with Pacoima. Pacoima on the MLS has 118 properties listed. In the latest month of data 62 homes sold. So to the public, this looks like a city with less than 2 months of inventory, a very healthy market. Yet if we add up the shadow data a very different picture emerges:
NOD (318) + Auction (630) + REO (148) = 1,096 shadow inventory properties
Add in the shadow data with the MLS data and you go from below 2 months of inventory to a whopping 19.5 months of inventory. This is why this is so crucial. It is the difference in a relatively healthy market and a very unhealthy one.
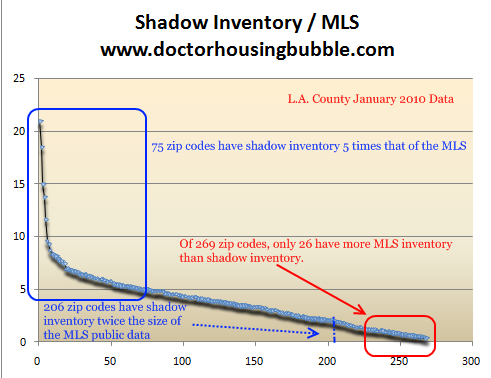
As I mentioned before, I pulled data on all 269 zip codes in Los Angeles County. I wanted to get a better sense how dispersed shadow inventory really was. Some want to paint a picture that only poor areas are subject to large amounts of hidden inventory. That is not the case:
Out of 269 zip codes only 26 zip codes had less shadow inventory than what was appearing on the MLS. 206 zip codes actually have shadow inventory that is twice the size of the publicly viewable MLS data. Even more troubling 75 zip codes have shadow inventory that is five times the MLS data. This data is compelling enough to make you pause because what is being presented is not the entire picture.
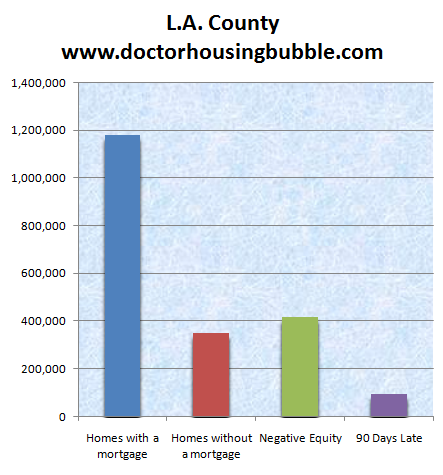
Let us get a better picture of L.A. County by pulling up demographic information:
In L.A. County 1.178 million homes have a mortgage. Over 350,000 have no mortgage. Of those with a mortgage over 400,000 are underwater. This shows us a market that is in high distress. Simply looking at the MLS data and going by what the banks are telling us is really giving you a distorted picture of reality. The market is saturated with distress inventory to the point of overflowing the above charts. Over 90,000 homes with a mortgage are now 90+ days late. And here is where we jump even deeper into the rabbit hole. Of active distress properties (NOD + scheduled auction) we get roughly 60,000 homes. We’ll leave out the nearly 9,000 REOs since these are now fully categorized as “foreclosed†and are owned by the bank. So you have another 30,000 homes in L.A. County that are 90+ days late but have no notice of default filed. What is going on here? It could be that it is still early in the process. But what is more likely is that banks are simply stalling out the process. Unfortunately we do not have access to this data since this is where banks keep their Enron style accounting statements.
If you add the entire potential data:
90+ days late but not NOD + NOD filed + Auction Scheduled + REO = Approximately 100,000 homes
Los Angeles County has roughly 100,000 homes as part of the shadow inventory. This is an enormous number given that the MLS only lists 19,400 homes. In other words, the potential pool of properties in the county is five times as large as the public is currently seeing. And these are properties that are in distress. At the very minimum this is a borrower that has missed three mortgage payments. The likelihood of future foreclosure is extremely high. How many of these homes are Alt-A or option ARM connected? Hard to say but we can easily estimate that the vast majority of the shadow inventory that is also part of the Alt-A and option ARM circle is virtually assured to default.
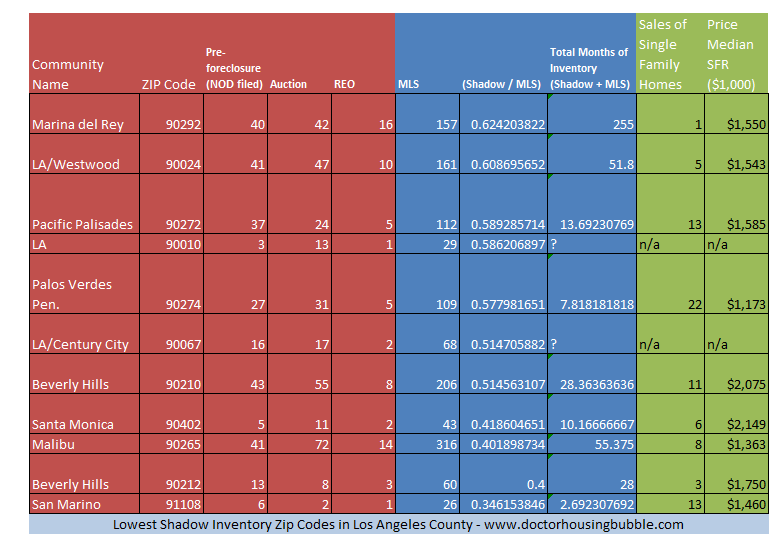
Some areas seem to have very little shadow inventory but it is in the area where the fewest people live:
Now as you will notice the median price of all these areas is solidly above the $1 million mark. But even here, you’ll notice the large amount of inventory. A place like Beverly Hills with the iconic 90210 zip code has over 28 months of inventory if we also include the shadow data. But this isn’t uncommon in high priced areas.
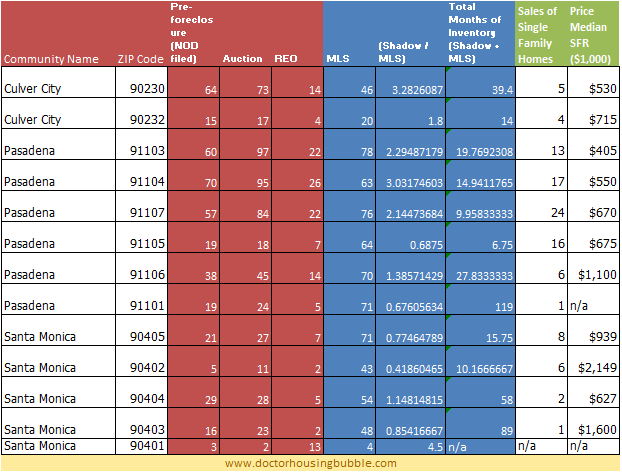
Now it would be cumbersome to show all 269 zip codes here but given that I have covered Culver City, Pasadena, and Santa Monica in the past I’m sure many of you would like to see that data:
The same patterns play out in these areas. Factoring in the shadow inventory the data takes a different shape. There are many factors that are going to determine where housing will head in 2010 but the above is rather clear. Shadow inventory is large in L.A. County and I would imagine an analysis of many other counties would yield similar results.
 Did You Enjoy The Post? Subscribe to Dr. Housing Bubble’s Blog to get updated housing commentary, analysis, and information.
Did You Enjoy The Post? Subscribe to Dr. Housing Bubble’s Blog to get updated housing commentary, analysis, and information

 Subscribe to feed


50 Responses to “Unlocking the Foreclosure Box – The Most Comprehensive Shadow Inventory Housing Analysis for Los Angeles County. Examining 269 Zip Codes and Finding 100,000 Shadow Properties while Public Views 19,000.”
I would wager $1,000 that not one Certified Real Estate Appraiser in 20 is factoring in the shadow inventory. They just don’t want to spend the time looking for the facts and adding them up and the Bank would stop using their services if they did. Chase Bank, Wells Fargo Bank, Citi and many other “too Big to fail” banks don’t want these figures to be published, disclosed or easily discerned. They were given warning 9/2005 that this would happen, but their bonus checks were not based on responsible lending so they didn’t care. They are crooks, if 4 of the Keating 5 had been publicly executed America’s melt down would not have happened at tax payers expense.
Great data, Dr. HB, but in your last table, I would recommend reducing the number of decimal places for ‘Shadow/MLS’ to one (1); same for the next column.
Thanks for another informative post Doc. A question about methodology here – how did you de-duplicate the data (e.g., make sure that the same house was not represented in both the NOD and auction sets)?
Regards,
Jim
Oh, I wish you would show all the zip codes. I am very interested in seeing a few of them in Long Beach, Cerritos, Lakewood, La Palma and Cypress.
Only the shadow knows…. Most educated buyers are know aware of shadow inventory and realize the RE Industry and the media are just cherry picking. The market has obvoiusly deteriorated and continues to worsen. The wildcard in all of this is what size HELOCS did many homedebtors get? My feeling is more affluent areas probaby took advantage of the “House ATM” and will be under “House Arrest” for many many years, unless they default.
Looking more and more like a “Double Dip” recession caused by housing in 2010.
http://www.westsideremeltdown.blogspot.com
http://www.santamonicameltdownthe90402.blogspot.com
Thanks for your effort in putting that together. It’s odd how you keep writing about the very questions I find myself wondering about. I’m going to have to check the closet and see if you’re hiding in there.
What is interesting is that this shadow inventory will ultimately be forced into a market (unless the banks become everyone’s landlord) where full income documentation is required. This will force a realignment of home values to income. In other words, watch out below! This is especially true of the upper/luxury market segment where self-employment requires underwriting with the borrower’s tax returns. That could be especially problematic.
Obama should revise Fannie/Freddie guidelines to allow no income doc with 20% down either investor or owner occupied. This brings in private capital to backstop values instead of government guarantees. What do you think is more supportive of the market, a no income doc buyer with a decent FICO and 20% down or a first time buyer with 3.5% down using FHA? I would argue the 20% down buyer is far less likely to default and even if they do, the first 20% of the loss is non-government backed.
Interesting number of 90 days late mortgages with no NOD filed. With mark-to-market no longer used, seems like the only thing the mortgage holders now have to worry about it lack of cash flow from these mortgages. As unemployment persists, how bad will this get before the mortgage holders capitulate and foreclose the properties? Tough one to figure.
Dr. Bubble,
Forgive me for being slow, but is it fair to assume that when the public is not aware of the full inventory, then prices are staying artificially higher than they should be?
Do you have statistics for Long Beach, including both urban and beach front neighborhoods? If so would you reference it in one of your up coming columns.
I can’t say for sure, but I think *some* mshadow listings are hidden until all the fat cats get to pick out the best ones before they hit the open market, just my opinion
Yes, but…. The deflationary tidal wave that the wise Doctor describes will be but a ripple compared to the ten-mile-high tsunami of inflation that it faces off against. Congress just voted to add 200 billion dollars to our nation’s deficit before it left on Christmas recess. That 200 billion was estimated to hold us over until mid to late February. So big deal, right? But nobody seems to understand the enormous danger in these numbers. The US has the biggest gold reserves of any country on earth, by a factor of nearly 10. We hold 8133 tons in Fort Knox, NYC, and other depositories. A metric ton contains 32151 troy ounces, and 8133 metric tons equals 261 million troy ounces, which at $1100 per ounce equals a value of about 290 billion dollars. It took millions of men working for hundreds of years to mine this gold, and now this wealth sits in Fort Knox backing up the dollar. In 8 weeks, we will have borrowed almost an equivalent amount just to pay our bills. Holding the dollar as a store of wealth may be about the biggest mass delusion in history! Can’t anyone see what is coming? Buy gold, silver, real estate, stocks, anything! But don’t hold your wealth in dollars or bonds. This isn’t a run-for-the-hills, buy-guns-and-canned-beans crazy talking. It is simply history as usual in modern economics. Look at the last 50 years for the currencies of France, Mexico, Brazil, et cetera. They all became worthless and were replaced with new currencies, and life went on, the rich and knowledeable getting richer, and the poor and trusting getting poorer. Get out of the dollar now, or lose your wealth. Don’t say that you weren’t warned!
I see a ton of shadow inventory (NOD/NTS). But I see a cancel or postponed rate of about 10:1. ie. for every 10 houses that are NTS, I see one go through as either REO or third party sale, rest usually get postponed. 90 days later, they are set for sale again.
The big question mark in my mind for Alt-A/Option arm are how many are left. I think quite a few may have defaulted already. Many have done short sales. Some people actually had decent credit and refied. All the data I have seen is on projected recasts starting really big in the next several months.
Now if you have still have one (Option Arm), I think you will be defaulting. Why? If you could lower your rate, you would have refied already. Maybe you are looking for a principal reduction–could happen, but you will ruin your credit with a principal reduction as well. Short sales might become very common, upon recast, in which case, I would expect to see those starting sometime around end of 2010. Why?
First wave starts recasting big time around May (makes sense, people start entering contracts starting March/April, close May 2005). 90 days before NOD–so no NOD until August 2010. Month or two to convince you need to do a short sale. Takes it to next September. Big time closings between June to September 05, so these will start short sales October-December 2010 and pretty much continue through 2011.
What we know now based upon record low interest rates and buyer tax credits is that the MEDIAN home price has started to tick up. Most of the loan balances on these option arms already exceed the Median, so even if they are short selling, median will likely continue to go up.
Bottomline, IF there is a fair chunk of option arms left to recast we will likely see prices (at the higher end) continue to fall through 2012.
Thanks for putting in the time to collect and present the data.
Hi Doc,
That was a lot of work on your part and thank you! This proves to the naysayers that there is such a thing as shadow inventory. How long can the banks stall the process? How much will the shadow inventory grow in the next 12-18 months with all the recasts? Could you imagine all these shadow houses in LA County quickly put on the market? Could you imagine if FHA actually required 20% down payment, 35% income to loan ratio, and good credit scores? House prices would fall back to 1996 levels in a year.
This is a massive cover up of epic porportions.
It seems the governments Home Preservation Foundation program (HAMP) is creating the next crisis, a foreclosure tsunami. Instead of a steady stream of foreclosures coming to market in 2009, we might be primed for a knockout punch in 2010/2011 if HAMP is declared a lost cause and abandoned. How long can they keep this house of cards from tumbling down?
Great work, really outstanding! I have some concerns:
1. I would like you to answer “JimatLaw” concern of duplicate data.
2. Los Angeles is going through a combination of many events. One thing is the “Urbanization of value” that happens in every long standing city. Well known in NYC where you basically have to inherit property to own it. Buying new requires assets of a business, another building, or extreme income.
3. Foreign investment. Two countries, Japan and China both have large amounts of liquid capital injected into real estate here. This cash movement into real estate helps the urbanization of property values also. I wish I could find some data to share.
Great data crunching, you do a good service to our community.
Hi Doc
You are so convincing that we all are following your advice and sitting on the side lines. Biggest question is where do we park our money ?(We worked so hard for last 10 yrs to save this money).
thanks for your time and effort Doc!
My 2 cents: Available forsale inventory will continue for years to be primarily distressed bringing a Japan style price plunge. Past correlations regarding days of inventory to sales prices for instance no longer functions as in the past and distorts our view. Your total market view provides a better overall picture and with time new corrections will begin to build but for now using past metric’s to predict RE prices may prove very unproductive.
@JS
Good question. If things were really so great, don’t you think someone might want to borrow your money to capitalize on the great green-shoot bonanza? Obviously not. Things are so bad they don’t even think of raising interest rates one iota. Good thing is that since there is no income, there are no taxes. I’ve got some parked in stocks that pay dividends. Some say bonds, but little guys don’t make much there. Gold doesn’t pay dividends and all-time highs don’t sound like a bargain to me. Commodities are risky. The days of the 10%/yr no-risk investment never were here, but now they’re not even a mirage. Some folks are making a lot of money on ammo…RHG trash cans are all the rage…
On top of JimAtLaws question…How do you make sure you are not double counting ones that are on MLS (probably as a short sale) and those that already have a NOD or NTS against the property.
Seems to me the conservative way (although you’d probably be eliminating a good amount of normal sales) is to do Shadow Inventory minus MLS Sales.
Great work. This matches the reality I see in San Marino, which looks to be the most stable high end market in CA. Please do Orange County as well.
Hi All
Something is wrong in this country where hard working people are struggling to buy a house and loosers/Banks/Flippers are rewarded. I been looking to buy a house for last 12 months in Cerritos. Market is contolled by Banks and investors.
1. Investors buy a 1100 sq feet home with 440 K all cash. Replace the garage door and upgrade kitchen with cheap material and put back on the market for 569K. Cerritos is filled with freeway noise but very good schools. Hard working people should not fall into investors/flippers trap. Hold on for few months….I know it is hard. DONT BUY SHI…Y house for $450 to $500 per sq feet.
2. We are going through through a tough time and Obama’s administration must do something to stop investors/flippers. Housing market can not stabilize until real people buy those houses at resonable price.
Aha, very educational. So it is this ‘shadow inventory’ that allows banks to scrooge condo-HOA’s…. By not completing the auction/foreclosure process the bank is “not responsible” for the HOA dues – yet the “homeowner” is not responsible either because they’re in default. How can this be legal?
One thing that would help is to know how this data compares historically. In other words, how much “shadow inventory” has there been in the past (if any). Also, has the shadow inventory been increasing or decreasing.
I would guess that the banks are hoping, praying, etc. that the whole system will slowly bleed out this shadow inventory without creating a huge price downdraft. Whether this is wishful thinking on their part or actually a viable plan is not clear to me.
In my opinion, the apparent “stability” (i.e. relative lack of shadow inventory in the data above) at the high end is just a timing issue. The subprime bubble happened first, thus larger progression to NOD then REO, etc. The higher end, which peaked later (i.e. 2007 vs. 2005) will catch up. For illustration, go to redfin, enter 90402 and ask to display sales for “last three years.” An absolutely ridiculous amount of homes changed hands during this period. Perhaps everyone in this zip will hold their homes in perpetuity, but I highly doubt it, especially when the underwater bill is high six, or even 7 digits, option ARMs/Alt-As reset in 2010 – 2012, etc.
Alphonzo
Gold is not close to “all time highs”.
You are the victim of brainwashing and don’t realize it.
The brainwashing is pretty simple, Gold is always measured in 1980 dollars PERIOD! In 1980 Gold was 850 dollars. If there was any other “commodity” available at 1980 prices most people would jump at the chance.
A gallon of gas, 80 cents, a new car 8000, an average house 50K and so one. But no, when Gold is just above the 1980 price you have been brainwashed into believing it is “near an all time high”.
The fact is everything goes up in price over the years due to the crumbling value of the dollar. Why is gold exempt? The answer is….it isn’t!
Gold at 850.00 in 1980 dollars is equal to about 2400.00 current dollars using the current Consumer Price Index. Using the Consumer Price Index that was used prior to 1990 (they spruced it up numerous times to make inflation “appear” lower) 850 dollars in 1980 is more like 3300.00 today. So, in real terms, and that is what counts, gold is about a third of its “all time high”.
Now, in 1980 we were in an environment where our FED could raise rates to 18% to break the back of inflation. Everyone is carrying so much debt today that should inflation take off (and it will) the FED will be unable to raise rates to the levels necessary.
In other words, how do you compare gold at 850 in 1980 under those circumstances to the circumstances of today? In 1980 the FIAT experiment was still a spring chicken but today it is an Old Coot and it shows.
I believe the Gold price when the FIAT system was a Spring Chicken versus an Old Coot is comparing apples and oranges.
Dr. Housing Bubble
Thanks,
Would you consider the sizeable number of delinquent mortgages in LA county that are not yet 90+ days?
Some speculate that almost every 30 day late mortgage will become 90+ day late.
You write,”Over 90,000 homes with a mortgage are now 90+ days late. …
Of active distress properties (NOD + scheduled auction) we get roughly 60,000 homes. ” which I think leaves about 30,000 homes 90+ days late with no NOD.
And if LA county average is the national average, which it seems to be for seriously delinquent categories, there are another 40,000 or 50,000 mortages that are between 30 and 90 days late.
The mortgage group puts on late, 90 day late, and seriously delinquent ( 90 day late and NOD) numbers that are in addition to their numbers for Notice of Default. There are about 2 houses nationwide (9.94 percent)that are late for 1 or more payments for every house in foreclosure.
About 2/3 of those houses that are delinquent but not NOD are over 30 but less than 90 days. ( 9.94 -4.74 percent – ( 4 million seriously delinquent mortgages/57 million – 4.74 percent)
So nationwide, for every seriously delinquent, 2/3rd have an NOD, and about 1/3 are over 90 days delinquent but no NOD.
“In the US there were 9.94 percent of mortgages delinquent 30 days or more,and and additional 4.47 percent of mortgages in foreclosure in Q3 2009.”
http://www.mortgagebankers.org/NewsandMedia/PressCenter/71112.htm
Depending on the where in the pipeline of defaults and NODs LA county is, there could be fewer delinquencies than current NODs, or there could be more than the national average of 2 delinquencies to every current NOD.
Great Work!
It’s nice to see someone else that takes the time to gather REAL data…have you see the FirstAM/CoreLogic report that just came out in the CAR news feed about Shadow Inventory? http://www.facorelogic.com/uploadedFiles/Newsroom/RES_in_the_News/FACL_Shadow_Inventory_121809.pdf
Great charts showing national growth…from 1.1 million units to 1.7 million units…we better all be ready for this next wave!
If you’re interested in north San Diego county numbers check out http://valleycentershortsalehelp.com for local numbers in this area…
Keep up the good work
Gold in 1980 was in a … what is the word I’m looking for … oh yea A BUBBLE. I know inflation schminflation but you still can’t eat gold, heck you can’t even live in it (and even a real home of genius you could in theory live in ….).
For those who may have an interest in Orange County, the shadow inventory using the same methodology as for LA is:
As of 1/4/2010:
NOD filing, Pre-foreclosure: 6783 units
NTS, auction scheduled: 9527 units
REO, Bank owned: 1849 units
So a total shadow inventory of 18,159 units.Active listings on MLS as of today for OC is 9,655.
Comment by jrs
And you can eat paper money, stocks, bonds, real estate? No but you can trade them all for food some easier than others.
Money is easiest to trade for food, next comes Gold, then stocks and bonds and last on the list is real estate.
I get a kick out of people who say “You can’t eat Gold” which implies you must be able to eat money or stocks and bonds.
Wow I cant believe how little shadow inventory there is in my #1 choice Pasadena 91105. I cant believe I have waited year after year expecting a TSUNAMI of shadow inventory to crush that zip – only to see that even if it all hit at once there would be less than 7 months of inventory.
That truly makes me want to throw up. It wasnt supposed to be this way.
in response to JS…
I second your observation in the West San Fernando Valley. The Marbury Park Group LLC (to name just one) has bought significant properties and done exactly as you describe and typically flip the properties in three months. There’s nothing of value for regular people like you and I who want to just buy a darn home to live in. Three weeks ago I decided that I’m going to find a nice rental and just forget about buying for two years!
It was hard finding something “nice” and reasonable, trust me. It’s amazing these rents people continue to try to ask. Anyway I found a great place with a huge pool, totally renovated, larger and for the same price that I’m currently paying!
Trust me, housing will tank this year. It’s the second leg down.
Pasadena seems to have a low amount of foreclosures on the market. When driving around, this shadow inventory as discussed in this blog is very true. I constantly see boarded up homes with the eviction notices when homes become REO’s. This inventory needs to come out sooner than later before it gets out of control.
Beware of the the next step the government takes to keep housing prices inflated: principal reduction. More and more articles and discussions keep bringing up this topic. We all know that the government will do anything it can to keep prices up, to keep foreclosures from flooding the market. Principal reduction would be the most obscene thing the government has ever done in the economic area. It would reward deadbeats, liars, flippers, quick buck artists, gamblers; and would punish the frugal, the responsible, and the renters.
Every time it looks as if the prices are about to be forced down, the government does something to keep them up. Everyone should write and call their congressperson, and express their absolute opposition to any form of principal reduction program. Of course, this may be one of those things that doesn’t have to be voted on, and is just enacted by fiat. It’s the biggest danger out there to the normalization of housing prices.
wow, I’m really glad I found this website today, I think it will be one of my new favorites. I’d love to see some comparisons for Orange County cities. I’m looking to buy in Laguna Niguel and have bee thinking of paying about $175 a sq foot. Lately, I’m starting to think that even that price per sq’ will be too high by the time this thing tanks
If they do in fact resort to principal reductions then this needs to be considered when doing “Comps”. The prices then come down and the market works. What will not happen is that suddenly all these people have suddenly $100K in equity in their homes that they siphon off to take vacations and buy ghastly Hummers…..
Seriously…. this will go on for years….. The banking lobby is too powerful to ever agree to principal reductions.
Slowing Pace of Home Sales Raises Fears of New Retreat
The number of houses placed under contract fell sharply in November in the first drop in nearly a year, new figures show.
The data indicate that the weakest parts of the country are the Northwest and Midwest, both of which fell 26 percent in November after adjusting for seasonal variations. The South dropped 15 percent while the West was off 3 percent.
(Temperatures in the East became cooler this November due to “Global Climate Change”)
What is an “RHG trash can”
Thanx Dr. Housing for a sustained excellent Web Site!
Love how the mainstream media is finally addressing some of the points raised on this blog and others.
Maybe the Congressional Oversight Committee is finally educating itself – check out the last part of the article with Geithner.
To Doctor Lee in Atlanta
“RHG trash can” stands for Real Homes of Genius trash cans referring to realtors photos of homes for sale that neglect to move the trash cans out of the picture frame before taking the picture.
Great post.
Any thought given to posting the full set on something like Google Docs. Would love to see data on the parts of LA I’m living in.
“RHG trash can†Yes, thanx, I figured this out shortly after posting the question. I’ve been a DHB reader for many months and why did not get it must be another bit of evidence of a weakening brain.
Dr. Housing Bubble,
Not quite sure your total Shadow inventory number (Shadow+MLS) is correct and is likely overstated… because I don’t believe it is taking into account the properties that are listed on the MLS for sale that are ALSO contained within the Shadow inventory. How many of those folks in the Shadows are also on the MLS currently trying to sell their properties. If you do not factor it in, you are overstating the total. (Shadow – (MLSandShadow) + MLS would probably get you more accurate results there.
Nonetheless, commendable work… and I don’t think it detracts from the overall point which is crystal clear. Thanks for the article and work!
@Dr Lee
RHG trash cans are Real Homes of Genius trash cans that appear in many of the photos, where a house is in such a bad area the agent takes a picture without even getting out of the car to move the trash cans, assuming the risk/reward is too high to get out of the car and move them out of the way.
I would agree the shadow inventory is understated by the gov and media. But you need to scrub the total by address to eliminate the duplicate listings as mentioned by several comments. Based on your sources of data there are probably many duplicates.
But good work…keep it comming.
BC
As always, an excellent discussion on the Shadow Inventory. I would love to see the data on the San Diego area, particularly Mira Mesa where I live…
Amazing work!!! Bravo!!!
The Scariest thing is that there are literally millions across the nation that are now 90, 360, 540+ who have not made a payment nor received a NOD. These people are not even registering in the shadow inventory.
It is just a matter of time before the people put down their pens, keyboards and pick up the pitch forks and torches
My 430k in loans were sold by the FDIC to Michael Dell for about 215k. They now refuse to let me keep the property at that price level or have a relative by me out at it. They are perfectly fine with a stranger buying it at that price (and thus lowering neighborhood prices further).
So, I’m not sure what is more obscene, helping regular people truly facing unexpected financial crisis, or helping billionaires become richer and continuing to lower home prices…
Excellent data! This information is very essential, no doubt. Let’s just keep our fingers crossed for improvement in continuity for the housing market. Keep on posting good articles HB!
Have you changed your figures for the homes that are in the Shadows but are also on the MLS currently trying to sell their properties?
Leave a Reply