Housing never really improved – 10 charts showing the United States housing market is entering the second wave of problems. 1 out of 4 people with no mortgage payment in the last year are still not in the foreclosure process.
To put it bluntly, the U.S. housing market today is in deep water. Nothing exemplifies the transfer of risk to the public from the private investment banks more than the deep losses at Fannie Mae and Freddie Mac. Fannie Mae announced a stunning first quarter loss of $13.1 billion while Freddie Mac lost $8 billion. At the same time, toxic mortgage superstar JP Morgan Chase announced a $3.3 billion profit for Q1. This reversal of fortunes has been orchestrated perfectly by Wall Street. Since the toxic assets were never marked to market, the big losses have been funneled to the big GSEs (and as we will show in this article, now makes up 96.5 percent of the entire mortgage market). In other words, banks are making profits gambling on Wall Street while pushing out mortgages that are completely backed by the government. We are letting the folks that clearly had no system of underwriting mortgages correctly or any financial prudence lend out government backed money and the losses are piling up but only in the nationalized Fannie Mae and Freddie Mac. What a sweet deal. Stick the junk in a taxpayer silo.
I wanted to go into the details on the current U.S. housing market and the data is not pleasant. In fact, it is downright disturbing. For background information, the U.S. has roughly 51 million active mortgages. As we go through the next 10 charts, it is important to keep this in mind. Whitney Tilson’s T2 Partners came out with some riveting charts regarding the current state of the housing market. Let us go through 10 of the most crucial charts.
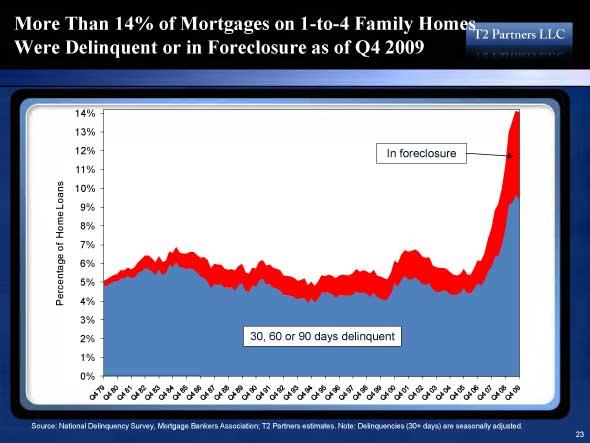
Chart 1 – Homes in foreclosure
The ultimate sign of housing distress is foreclosure. This should be obvious. So for all the talk of a housing recovery I point to the above chart. Today, as in right now, we are in record territory for the number of homes in foreclosure. 14 percent of all U.S. mortgages are in some form of foreclosure. If you do the rough math, this equates to:
51 million x .14 Â Â Â Â Â Â Â Â Â Â Â Â Â Â Â =Â Â 7,140,000 mortgages in default or 30+ days late
I always get this question about how folks arrive at the figure of 7 million. The above equation should give you an idea. This by the way is not a good situation. And with many toxic loans including option ARMs and Alt-As still lingering in the market, we have a few more years of problems baked in unfortunately.
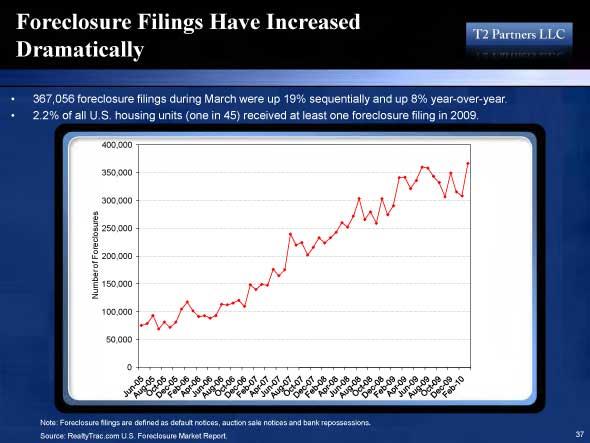
Chart 2 – Foreclosure filings
Building off chart one, foreclosure filings are still at record levels. In fact we are heading to a 3.5 to 4 million foreclosure year in 2010! This is somehow a positive thing for the market? People forget that foreclosures happen because of underlying economic issues. If everyone was making big bucks and homes were going up in value then we wouldn’t have this problem. Just look at the number of foreclosure filings back in 2005. Roughly 60,000 to 70,000 per month. Last month we hit 367,000+ which was an all time record. When foreclosure filings get back down to more normal levels, then we can say the housing market is improving.
What about strategic defaults? At most, 1 out of 5 foreclosures is probably a strategic default. But that means 4 out of 5 are losing their home because they can’t pay. This is why we absolutely need bigger down payment requirements. If you get a government backed loan (aka the 96.5 percent of the market) then you should at the very minimum put down 10 percent from actual cash sources (no using tax credit nonsense).
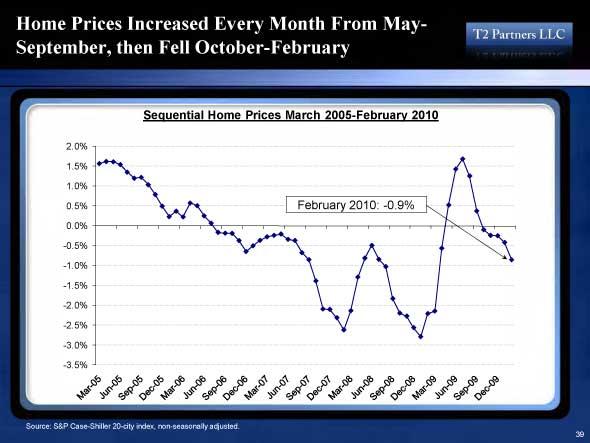
Chart 3 – Home prices dropping
I think some people have a hard time understanding why home prices have fallen lately. Well, when a large part of home sales are distress properties prices usually shoot to the downside. We had a nice little bump from the alphabet soup of government programs including HAMP, tax credits, and other gimmicks but the trend is back to lower prices. Why? Because the underlying economy is still not healthy. Now that people have to at least show some proof of income, it turns out that many cannot afford high priced houses. Is this a surprise to anyone that going with an easy cash advance did not work? What do you expect when your strategy involves kicking the can down the road? The above chart basically shows one World Cup kick to the can.
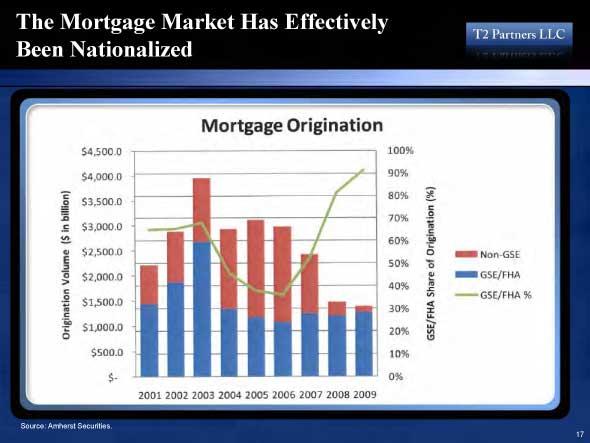
Chart 4 – Nationalized housing market
Congratulations, you are the housing market. 96.5% of all originated loans are now government backed. Remember Fannie Mae and Freddie Mac and their epic continuing losses? Apparently banks have no problem originating loans as long as they can use the government money to gamble in the stock market.
Wall Street enjoys handing your money out. They like to beat on their chest about the free market but have no intention of lending out their own money (i.e., your bailout funds). In fact, Wall Street has convinced itself that your money is basically their hard earned cash. For the risky housing market, they’ll be the middleman in lending out mortgages that are defaulting in mass. What do they care if the economy is on stable footing? They don’t care if you lose your job and can’t pay the mortgage in one or two years. By then, the banks will be gambling in another bubble putting another sector of the economy at risk.
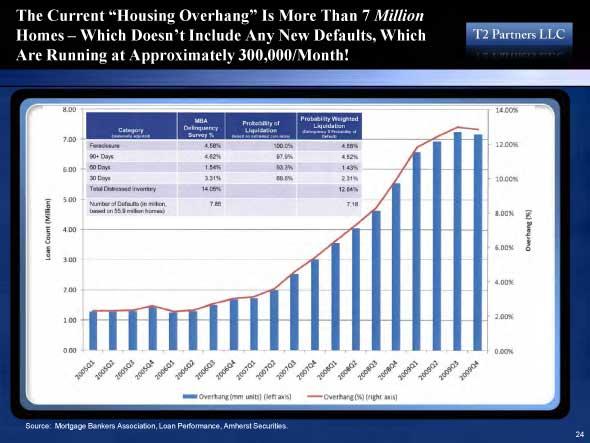
Chart 5 – Housing overhang
Remember that 7 million figure? Well there it is. Keep in mind that we keep adding to this pile because foreclosure filings are running at 300,000+ per month. So the market is actually saturated with inventory. You may not always see this in the actual data but we’ve gone through multiple case studies of shadow inventory. This large amount of overhang will add additional pressure to housing prices in the next few years. In fact, with this amount of housing we have anywhere from 7 to 9 years of inventory to clean out!
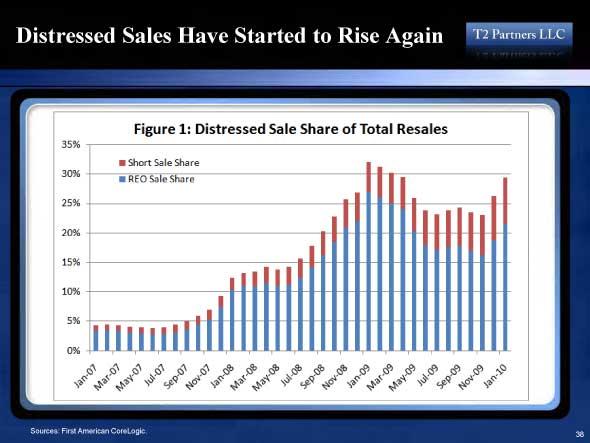
Chart 6 – Distress inventory as sales
The dip you see in 2009 was basically the failed efforts of HAMP and other bank stalling efforts. Now that banks have basically nationalized the housing market and have made Fannie Mae and Freddie Mac their dumping ground, they really don’t care. They can use the taxpayer money they get under the guise of helping homeowners to speculate on Wall Street while funneling GSE debt to the public. An absolute win for them. The biggest and most risky of debt gets pushed to taxpayers while the lion share of profits stays in house as bonuses. The system couldn’t be more corrupt or broken.
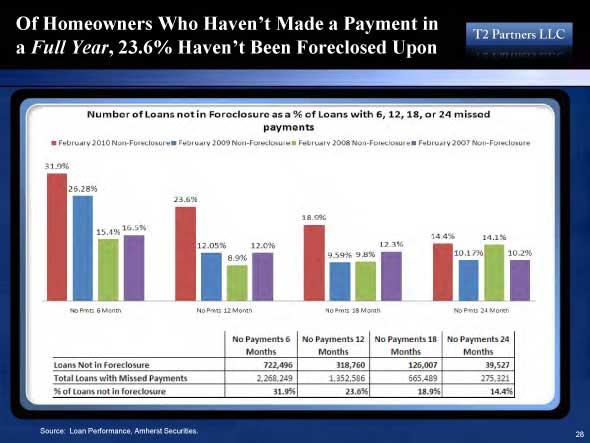
Chart 7 – Not paying and living with no foreclosure
This is a stunning chart. 24% of those that have made no payment in the last year are still not in foreclosure! In other words, you have tens of thousands of people living rent free while banks pretend everything is fine and claim billions of dollars in profits. What a sham! Just look at the 24 months with no payment column. 39,000 people have not made a payment in 2 years and no foreclosure has been filed!
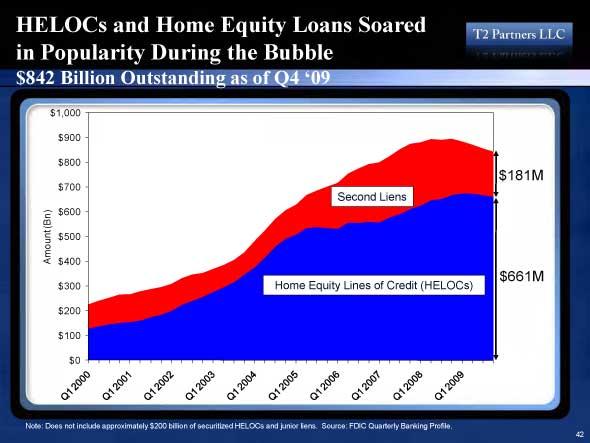
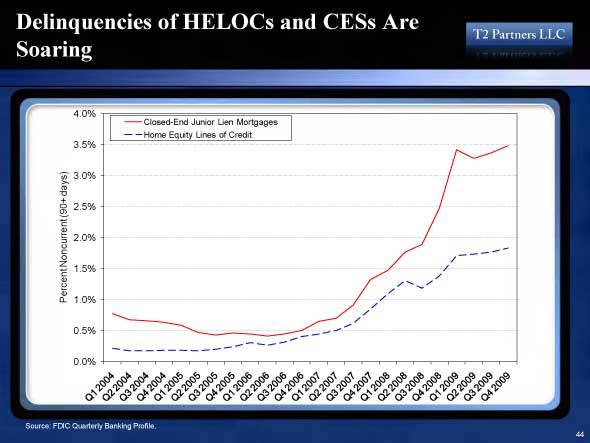
Chart 8 – Home equity lines
With so many homes underwater, the second mortgage market has virtually disappeared. But we still have $842 billion in loans made during the peak of the bubble outstanding. Most of these are actually held by the big four banks and that is probably another reason why banks are moving aggressively against some while letting others stay in their home without payment.  In fact, if you look at the above chart it seems that if you leveraged yourself with multiple mortgages banks might wait to move on you while if you only had one mortgage backed by a GSE, you’re out. Fannie Mae and Freddie Mac defaults on standard mortgages are spiking to record levels.      Â
This means further bank losses but can Wall Street gambling outpace the losses from the housing market?
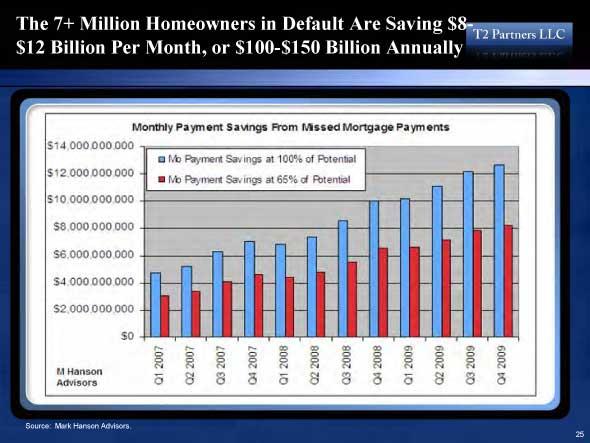
Chart 9 – nonpayment savings
There is an upside to not paying on your mortgage. More money to spend! Ironically some of the recent increase in consumer spending hasn’t come from job gains or actual employment improvement. It has come from people not paying their mortgage, downsizing (or getting a similar house for half off), and using the freed up income to spend. The estimate is that $8 to $12 billion per month is freed up from people not paying on their mortgage.  You must have some uncanny self delusion to spin that as good news.
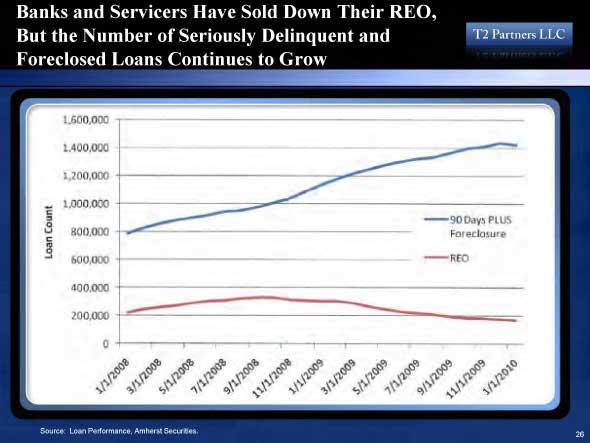
Chart 10 – REO vs distress
This chart pretty much sums it up. Banks are moving on current REOs (the small batch that they have) and pumping this up as good news but the 90 days plus foreclosure number is still trending up. How is this magic done? We’ve talked about it above. You simply don’t move on delinquent homeowners. You ignore actual losses. You mark your assets to fantasy valuations.
In total the housing market is in worse shape today than it was a few years ago. If the stock market was tied to housing we probably have a Dow 20,000 with 14 million foreclosures. The bailouts have been one large transfer of wealth to the banking sector. Remember that the bailouts were brought about under the guise of helping the housing market and keeping people in their homes. None of that has happened. Ironically the only thing that seems to keep people in their home is when they stop paying their mortgage! If that is the strategy we have arrived at after $13 trillion in bailouts and backstops to Wall Street we are in for a world of problems.
Did You Enjoy The Post? Subscribe to Dr. Housing Bubble’s Blog to get updated housing commentary, analysis, and information.
Did You Enjoy The Post? Subscribe to Dr. Housing Bubble’s Blog to get updated housing commentary, analysis, and information

 Subscribe to feed



29 Responses to “Housing never really improved – 10 charts showing the United States housing market is entering the second wave of problems. 1 out of 4 people with no mortgage payment in the last year are still not in the foreclosure process.”
Amazing article, Dr. HB. Just reinforces for me the insanity of buying in this market.
“In fact, if you look at the above chart it seems that if you leveraged yourself with multiple mortgages banks might wait to move on you while if you only had one mortgage backed by a GSE, you’re out.” Translation: The more irresponsible you were, the more help you get. No surprise here.
And over here on the East Coast the front page of Newsday yesterday had a story about the record number of home sales on Long Island last month. Prices actually went up a bit.
All is well here! Nothing to see move along.
Aimlow Joe was here.
“In fact, if you look at the above chart it seems that if you leveraged yourself with multiple mortgages banks might wait to move on you while if you only had one mortgage backed by a GSE, you’re out.â€
That’s true. In my old hood, there were several people who were walking away as the homes hit 30, 40, even 50% underwater status. Those of us who had a single loan were out in about six to nine months (pretty fast given the norm at that time) but those who had multiple loans/refinances stayed without paying for up to two years. I didn’t understand why and didn’t care but I thought that was strange.
good stuff as always, thanks for the info!
Great charts to use in a housing discussion. Some people still have the audacity to say charts mean nothing and that if I really wanted to see what was going on to go out there and place a bid on a home. The madness is still out there they say. IMHO if more stories of Strategic Defaults become mainstream .gov will have no choice but to let the correction run it’s course. There is no argument for spending tax dollars to keep Strategic Defaulters in their home.
So on chart that shows the 7 Million plus homeowners in default who have not paid are saving $8-$12 Billion per month I wonder what their tax situation will look like? They will not get their mortgage interest deduction so their final taxes will go up. Ah……so the government will however get a piece of that through higher taxes revenues.
what a system. maybe that’s is another reason why the banks are not starting the forclosure process. The government does not want them too.
Amazing article and shows the truth of the Foreclosure Scam in simple charts and easy to understand language. Here in Arizona, the local newspaper the Arizona Republic, keeps on publishing articles that are designed to pump up the fraudulent housing bubble even in the face of growing foreclosures and strategic defaults. The current housing market is truly built on hype and fraud, thank you Dr. Housing Bubble for making the connection between Wall Street (aka Fraud Street) and the GSE’s Fannie and Freddie (banker patsies). Those dirty banksters are using the old bait and switch to keep filling their pockets at the expense of naive and downright stupid American tax payers.
@David, I don’t know that I agree that the government is saving money because more people are unable to claim the mortgage interest deduction. However, I do think that the government is actually making more money via sales tax from the increased consumer spending as a result of people having more disposable cash while waiting for foreclosure. Perhaps this is a reason for government to encourage stalling foreclosures…
What’s a lowly renter to do?
How many here that read the posts actually are writing letters to their congressional reps complaining of the taxpayers footing the bill of the banks reckless lending? How many here continue to vote for the same old congressional reps such as Boxer and Feinstein? How many here have pulled their money out of banks and put them in credit unions as a silent protest? How many here have written letters to newspapers complaining of the bailout?
All of you who voted for Obama or McCain should vote instead next time 3rd party. Out with Republicrats!
Matt,
Yes, EVERYONE who is fed up needs to do all the things you listed. Most of all, start voting Independent. The Democrat and Republican parties need to go away, crumble and (maybe) start over without career politicians.
I live in Rockford, Illinois. Not exactly a hot bed of real estate activity. Unemployment here has run in the 8% to 15% range for decades (currently at the upper end of that range).
There are 4 empty homes on my side of the block. Only 1 has a For Sale sign.
It is not just California.
The home I live in (rental) has been in default for two years. Due to some lies by the present owner the foreclosure process has been restarted. Any excuse to keep it off the market I guess.
The current “owner” used the property as an ATM.
Great article Dr. HB. We live in fantasy land here in California. The decent areas are still completely and totaly inflated. Finding anything decent for under 500K is almost impossible. Many of the people buying today at these inflated prices will lose their homes in a few years. The cycle of a distressed housing market will be never ending.
It’s crystal clear that the government views housing as too big to fail. They will do everything in their power to keep this ponzi scheme going. I think they might have bit off more than they can chew this time.
I just switched from Chase bank to my local community credit union. If we all did this, we would accomplish what our representatives refuse to do for us. We would break these too big to fail banks. We can do this w/o any legislation being passed. Do not focus or complain about the things you can’t do anything about. Just stop doing business with Chase, B of A, Wells Fargo, and Citigroup.
Great Charts and info..Thanks!
While the focus has been on REO and NOD activity as a benchmark of market health another issue that has been lost in most discussions has been the role of move up buyers. Going to be difficult to find large enough groups of homeowners with significant equity to push up into higher priced home bracket’s even as the flow of REO’s level off. My guess is that homes that are priced above a regional county median price will come under significant pricing pressure continuing a very long deflation in home pricing.
out here in real estate la la Cali land as well… agreed, market is completely inflated still in the “location, location” areas – beach areas…. tons of for sale houses, rentals — houses that sold a year or two ago now have a sign out front again…
My fear on all these charts that simply show the market has to come down — is that in “nominal” terms this is true — but with the continued out of control printing by the FED of the dollar — that inflationary “high dollar numbers” will just fill itself into housing. So the nominal true worth of the real estate will fall, but the due to FED monetary policy to “inflate it all away” — the “sticker price” will remain high, Illustrating the effect of “reduced purchasing power of the dollar” while concurrently keeping housing prices distorted and high….
We see this in the stock market — charts showing SP500 deflated by gold reveal the inflationary effect giving the illusion of rising value in terms of “prices” — but when using gold — it’s proof most all that is inflationary.
Yes, what is a renter to do ? I’m thinking minimum two years before buying – and ignoring all the “noise” about last chance, tax credits, etc…
example: Friend is 50% underwater — home is now half what he bought it for — from 400k to 200k. He drinks the kool aid and bought at the peak of the market – I thought he was crazy then.. Anyways, new neighbors moving in next door to him paid half what he paid — he is diligently still making his mortgage payment — to me that’s insanity. We can talk about morals and commitment/responsibility — but the wall street back story on how this all came to be – surely, even if my friend keeps making his payment to “save” and “uphold” the system — many many more will jump into the “strategic default club”… since they come to accept their pumped up price was due to mortgage fraud. Why wouldn’t you default? who pays twice as much for something when the sticker price is that high? Is my friend going to continue paying for the next 30 years like that? It’s this dilemma that brings me back to thinking that – through inflation – people like my friend may be saved over the long term. (Although he’s forfeiting the short term dollar strength by taking those dollars and paying his mortgage instead of investing elsewhere in an appreciating asset).
If they charted housing prices in relation to gold — home values would be seen dropping even faster — ala the above SP500 example — no?
Ahey…good post and I agree. I AM one of the homeowners who got caught by the U.S. perpetrated fraud. I say U.S. because that is EXACTLY what it is. The banksters and the crony politicians designed this and fed it. I am currently upside down and I see now end in sight to it. I am close to rental parity at the moment because I FORCED a loan mod two years ago and I now have a 2% loan for 5 years. I still want to walk from the home based on principle. They committed fraud and not a damn soul is going to jail.
I’ll stay in my house for 1 more year for sure, and if the system keeps the fraud going through artificial propping of home prices, I will walk and no amount of “guilt” anyone attempts to throw on me will make any difference at all. In fact, with what I’ve seen in the last few years, I’m making my own mind up on which laws I’ll follow and which ones I will not.
Oh yea, good going Lake Forest, make those pot shops illegal, fight the will of the people! I’m a good republican, I’m for smaller government and freedom, unless I disagree with you and then I’m all for a police state and water boarding your a$$. OC, such a nice place to live…..not really.
The future RE market will probably look very much like today..
1. GSE underwriting on 95% of loans
2. GSE lender rules dominate the makeup of the market
3. Older market model, move up buyer, private lender financing dead
4. GSE model will be income driven, low down payments,low interest rates
5. GSE model will force the bulk of home prices towards greatest number of qualified buyers in any given region. Homes above the average or medium sale price will have few buyers so the price banding within the market we see today will likely disappear except for high income households.
6. remodeling,add on’s etc will disappear, Home Depot local builder supply will go BK..nobody will want to add dollars into housing they cannot get back.
7. GSE’s will create lease/buy contracts which will be very similar to rental in today’s market giving buyers greater flexibility to move without hardship.
And Vinny Del Judi from the Treasury framing all the data to sound like a recovery : “Employment improved because Only 440,000 first time unemployment. ”
You’re right Doc, the jig is up, were over the HAMP, and we’re going over the cliff in a an REO speedwagon. The bankers need to realize that the true golden goose is the slave middle class. When they completely destroy us, who will they have to go fetch stuff for them and fly their jets?
In case anyone wondered about Kid Charlemagne, it was a Steely Dan song about an LSD tycoon in the 60’s/70’s and the whole California halucination thing. All those day-glow freaks who used to paint the face are in the FIRE economy now. I think we’re having a bum trip…Here come the flashbacks folks. Going to be a bumpy ride for a while…
I am transferring my money to ING, screwing the big banks
I don’t know why people keep pounding the inflation drum.
Yes there will be inflation in the future.
But not with 9%+ nationwide unemployment and 20%+ effective unemployment(including the underemployed and those who have stopped looking for work).
For all the printing the Fed’s are going to do, there is simply not going to be some doomsday Argentina situation happening here. Its going to be years before we recover those jobs and the average american has a reasonable amount of spending power. Remember inflation occurs when too much money is competing for too few goods and services. Right now, business’ are having a hell of a time selling goods and services.
The kind of inflation seen in Argentina or Zimbabwe is caused by the govt on purpose in order handle a debt load that’s completely unsustainable. So, one has to ask themselves when this level is approaching? It appears that when the debt payment reaches ~ 40% of tax revenue collected, there’s no going back to “normal” with the currency.
@Bob,
There’s more than one kind of inflation:
Yes there will be little demand-pull inflation, but Americans are still very stupid. Many think everything is fine and are mistaking green trash cans in front of 873 sq-ft RHG’s as green shoots. We still buy crap and go into debt to do it. We’ll make a foolish decision to buy a 250 k house for 600k if someone will lend us the money. People got used to $3 gas and are buying wasteful vehicles again. I’ve read of people on food stamps that spend all that and way more on groceries, like this is a blip in the road and everything will be cool again soon. We got tired of austerity pretty quick, once it fell out of fashion.
The insideous and permanent inflation is currency destruction. Not everything inflates at the same rate, obviously, but things ratchet up because there is more elasticity on the way up than on the way down, which is the whole problem with SoCal Real Estate. Buying in is a decision, while selling out you are at the mercy of buyers. Many people would be financially devestated to sell at what the real market would bear. But since the FIRE industry is too big to fail (don’t even try to make an argument here about that) the sellers that can hold on are holding on with their lives. But distorting the markets and kicking the can down the road just make the dam burst worse than it should be.
Disclosure: Sabin Figaro is a character from Final Fantasy. The California Dream is the Final Fantasy. Put another salmon on the grill and pour me another Chiraz. Fantasy beats reality any time. There’s Fannie and Freddie pulling in the driveway now…What an oxymoron–REAL estate.
I think the western world is in for a long period of stagnation. Increasingly Japan looks like what we are headed for. They have tried everything to stimulate demand and they seem to be in mild deflation on and off for almost 20+ years. We have 300 million people and I just read today 40 million are on food stamps! 40 million people on food stamps! Where is the demand going to come from? China and India are where we were 20-30 years ago and still have a few decades of rapid growth left in them. Though China may be subject to massive political trubulance. But we are overbuilt and spent like drunken sailors for quite a while. We also have no new industry, no new dotcom , no engine for job growth in the near term. What is the next dotcom? The job market is improving, but there are millions more who have given up and have their lives turned upside down. We need something to power our growth and I don’t see anything near term?
The figure of 14% delinquent is a stunning number; it is indicative of an underlying problem of unemployment; Alt-A, Option-Arms and Interest only loans coming due; and also loan owners being underwater and not wanting to continue to pay.
I am of the opinion that subprime mortgage lenders, foreclosed on low FICO scoring, that is working class and low income neighborhoods, which includes Englewood, Illinois.
Whereas, on the other hand, bankers have held off foreclosing on Alt-A and Option-Arms higher FICO scoring middle class neighborhoods, as FASB 157 has preserved the lending portfolio at mark-to-manager’s estimate, rather than to mark-to-market. Documentation for such holding off of foreclosing comes from your article which relates that 24% have made no payment in the last year are still not in foreclosure.
You provide the Nationalized Housing Market Chart which shows that the percentage of GSE financed homes fell from 2003 to 2006 as the banks issued Alt-A and Option-Arms first, second and third mortgages; and then bundled and secuiritized these into CDOs; which some sold short and others wrote CLOs on. These are the ones that the banks have on their books that are just sitting there. These contrast with the REOs, that is the suprime loans which have been written off.
You said it this way in your article: â€Banks are moving on current REOs (the small batch that they have) and pumping this up as good news but the 90 days plus foreclosure number is still trending up. How is this magic done? We’ve talked about it above. You simply don’t move on delinquent homeowners. You ignore actual losses. You mark your assets to fantasy valuations.â€
If one does real estate, demographic and neighborhood research on Englewood IL which is zip code 60621; using the tools below; one will find that it is a low FICO scoring, that is working class and low income neighborhood where property values were decimated by foreclosures.
Blockshopper Englewood IL Neighborhood
Redfin Englewood IL Neighborhood
City-Data Englewood IL, 60621
AOL Neighborhoods Englewood IL
Mike Mish Shedlock recently wrote an article recently relating that Illinois is bankrupt.
and relates Illinois just sits, bankrupting companies the state owes money to but has not paid. I believe that social chaos could easily erupt in Illinois very soon as the state fails to pay for social services; and property values are really going to fall across the state..
A black swan event is going to be the catalyst to move the squatting strategic defaulters out of the houses — the age of home lending is about over — the age of home leasing is about to start.
TylerDurden in ZeroHedge article Roubini: The US Economy Is Unsustainable writes that Nassim Taleb said that his primary concern about an upcoming “Black Swan” is a failed Treasury Auction. This is precisely what Zero Hedge has been concerned about for the past year, although we feel that this event will likely be at least marginally telegraphed, either in the form of Direct Bidders taking down close to 50% of each auction (with the Primary Dealers monetizing the balance), and an accelerated flattening of the yield curve. Last night, Roubini, who has apparently thrown away the mantle of moderation and is back to his gloomier ways, said that he worries “that with a trillion deficit this year and next year, 2012, and for as far as the eye can see, eventually, not this year, but the next year, the markets are going to wake up and say, this is unsustainable.” In other words whether via the Treasury market, or some other way, at some point the balance will shift from one where the market still believes that reserve currency is enough of a backstop to prevent the collapse of the US, to a regime where incremental bailouts will be seen as negative. That moment will be true black swan, and the beginning of the end of the great US experiment.
A failed Treasury auction would be disaster as the Treasury is running on empty … well it is running on fumes as Vincent Del Giudice of Bloomberg reported on May 13: “The U.S. posted its largest April budget deficit on record as receipts declined in a month that typically sees an increase in individual income tax payments. The excess of spending over revenue rose to $82.7 billion last month compared with a $20.9 billion gap in April 2009. April marked a record 19th straight monthly shortfall. Deterioration in the government’s balance sheet in coming years raises the risk of higher interest rates even as an improving economy helps lift tax receipts. ‘With the recovery in place, we should be seeing higher revenue and lower outlays, not the other way around,’ said Win Thin, senior currency strategist at Brown Brothers Harriman. The government’s April budget deficit compares with a median forecast of $57.9 billion. The last time the U.S. had back-to-back April deficits was 1963-1964. For the fiscal year that began in October, the budget deficit totaled $799.7 billion compared with $802.3 billion during the same period last year.â€
My thoughts are that the black swan moment will see a rapid exit from the stock and debt market places; there will be very few buyers in the market place and prices will will fall like a rock. There will be a liquidity evaporation, meaning that one will not be able to access one’s funds in money market accounts and brokerage accounts.
The black swan moment will mean a soon-end to funding of Freddie Mac and Fannie Mae; and as a result home lending will come to an end. As people default on mortgages, the financial institutions will lease properties, and not sell them as interest rates will quickly rise and be much too high. The banks will now longer allow Strategic Defaulters to squat in the houses. The number of realtors will be greatly reduced; the number of property leasers and mangers will grow.
@Caboy
Everyone thinks Japan was so brilliant. What they did is what the Chinese are doing. Bankrolling large businesses so their products are cheaper on the foreign markets, then have exploding exports. Companies don’t have to worry about making a profit, just cornering markets. When the banks that finance them go broke, the government bails them out.
Japan is reaping what they sowed, just as China is now. China’s products suck, but we have largely gone with the lowest price and forsaken our industries. Japan’s quality is much better but now they are not cheaper. Korea, Taiwan, etc.
The point is and why it is germaine to the topic as that, if you haven’t been convinced by the doc, then you won’t until it hits you in the face, this is the grand super-bubble, and it wants to unwind. When it does, the entire world’s fake economy will be so devestated we will have to start from scratch, just like after WW II. It will not be fair and there will be huge winners, but mostly losers. Buy now, and you will be a loser. This is going to be ugly. Just stay liquid for now. Resist the next slide down, because there is a long way to go.
The Census keeps track of the total number of housing units existing in the US each year. A chart for the period 2000 – 2009 can be found here. The decline in the slope of the increase is obvious starting in 2006.
Leave a Reply