Dissecting a County of 10,000,000 People: The Housing Demographics of Los Angeles.

As we reach a record 16 year high of inventory, the biggest supply since 1991 we are starting to realize that housing was fueled by easy credit. If housing wasn’t fueled by easy credit and went up because of rising incomes and demand as many in the housing industry proclaimed, then why in a few short months has stopping subprime lending and Alt-A loans brought the entire market to a screeching halt? It is becoming more apparent that lax lending standards and easy credit were the fuel that kept this fire burning even though the wood was turning into ash. We were running on fumes. The only thing that would keep this boom going is less restrictive standards and I’m not sure how much lower we can go without our money turning multiple colors and becoming a real game of Monopoly. Unbelievably those in the housing industry and politicians are calling for weaker standards. Here is a list of some of their ideas:
· Increase mortgage caps from $417,000. Since anything above this is considered jumbo many in the industry want these caps higher because areas such as
· Dropping the Fed Funds rate. The Fed has already dropped the discount rate.
· Bail Out Funds. A local official is looking to create a multi-million dollar bail out fund for families in foreclosure. The preliminary information seeks to give struggling families $10,000 in assistance. $10,000 will buy a family maybe 4 months at current
· Bring the Government Into the Subprime Arena: This is one of the absurd propositions and a perfect example of corporate welfare. Wall Street is no longer buying these risky loans. Instead of learning the lesson that maybe there was some irrational exuberance in the credit markets many are now calling on the government to back these loans.
These “solutions†miss the boat completely because homes are simply not worth what people paid for them. Plain and simple. Incomes could not support market prices without the crutch of exotic banana republic loan products. The loans almost by default encouraged flipping and a nomad culture of moving up into larger homes. There is really no purpose for a 2/28 loan or many of the other mortgage products that flew into the market. Many will argue otherwise that this is for the sophisticated investor. Maybe. But it wasn’t used this way. See, the underlying message of a 30 year fixed conventional mortgage implies that you are looking to stay in your home for a few years. If the market goes up, then you sell and move on. You didn’t have a ticking time bomb forcing your next move with an invisible hand. If the market went down and wallowed in the dumps for a few years, at least you knew your payment was fixed. Now many are facing down the barrel of a locked and loaded mortgage ready to reset in the face of a depreciating market. Whether they knew it or not, they’ve suddenly become speculators and are witnessing a margin call. Either pay more cash to stay or sell. And many of these loans had 3 year prepayment penalties. Basically these products only made sense to those earning higher commissions and hungry investors chasing higher yields.
With this as our back drop, I wanted to dig into the demographic facts of
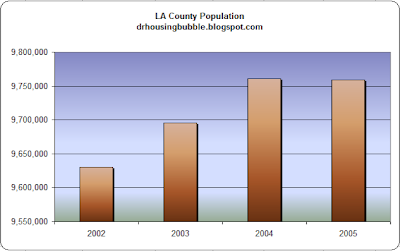
Argument #1 – Housing has boomed because of population growth.
First, as you can see from the above chart the population of
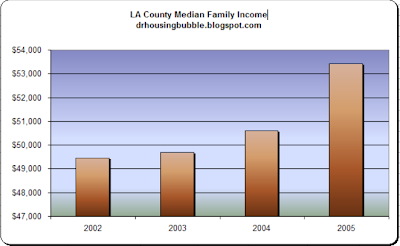
Argument #2 – Income growth is in direct proportion to housing appreciation.
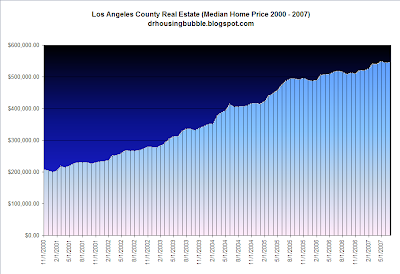
Clearly income growth is not the reason for housing growth. Even with the big jump in 2005, the median family income only increased by 5.5 percent. The previous three years saw stagnant wage growth. However, during this same time period we find the following data for housing prices in
Median LA County Home Price:
2002: $266,000 (July 2002) YoY Increase: 15.1 percent
2003: $328,000 (July 2003) YoY Increase: 23.3 percent
2004: $406,000 (July 2004) YoY Increase: 23.8 percent
2005: $488,000 (July 2005) YoY Increase: 20.2 percent
2006: $520,000 (July 2006) YoY Increase: 6.6 percent
2007: $547,500 (July 2007) YoY Increase: 5.3 percent
Doesn’t exactly coincide with the data we are finding does it? In fact, we had three years of consecutive 20+ percent annual price gains! The annual housing price gains amounted to more than the annual family median income in the county for 3 years. Why work when you can live in your home and make more money than your job?
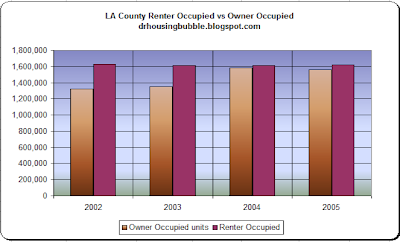
Looking at Owners vs. Renters
Argument #3 – 70 percent of people own their homes in the
The caveat to the above argument is that this statistic doesn’t apply to
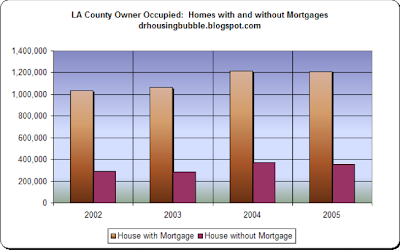
Argument #4 – Many people own their home with no mortgage.
Clearly those without a mortgage are a very small subset of the market. In fact 4 out 5 owner occupied homes do carry a mortgage in
Argument #5 – It is only slightly more expensive to own as opposed to renting.
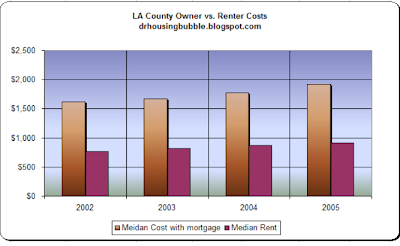
Again, for 2005 the monthly cost for a home owner was $1,919 while the median renter carried a monthly housing cost of $918. Owning a home, as opposed to renting is 109 percent more expensive in
Argument #6 – When you own your home outright, you no longer have to worry about any further payments.
As you can see from above even the untouchables, those who have paid off their mortgages completely still have to pay something. In fact, in 2005 with approximately a $400 median monthly payment, they are carrying half the amount of a median renter. Given that this is a very tiny sliver of the market it is interesting to break some of the myths flying around
Conclusion
We’ve seen countless articles hitting the mainstream media regarding the mortgage debacle. Yet the mainstream media paints in large strokes. That is, it is hard for them to devote a 5 page in depth analysis on one specific market. That is the implication behind broadcasting – you try to reach a broad audience. However, when we examine the demographics under a magnifying class for
Do not make the mistake of seeing this as only an economic chart. Behind this data, 7 years of dreams and hopes built on the back of real estate play out like a novel. In this chart we see the birth of shows such as Flip this House, Property Ladder, Flipping Out, Real Estate Pros, and of course the Apprentice where 20 to 50 percent of the contestants made their small fortune in real estate depending on the season. In the chart is also the story of new industries and high paying professions. The number of California Real Estate Agents jumped in tandem with the above chart. Mortgage brokers, construction, hedge funds, and all things real estate seemed invulnerable to any market woes. This was an unstoppable train with an endless supply of steam. As we sit at the apex, wondering how this decade long housing bull market will end, many have been conditioned to know only one thing about housing. And that is real estate never goes down. As this speculative game winds down, there is an eerie calm engulfing the market.
Keep in mind the data we are digesting regarding sales and prices is still 1 to 2 months delayed since escrow filings and closing data lag the current market information we are seeing. Which means data we are digesting today was immune to the recent ugly stick beating the mortgage market underwent. Logically it follows that any future data will be worse because of the now dwindling credit markets. If we are to revert to market fundamentals, housing in
 Did You Enjoy The Post? Subscribe to Dr. Housing Bubble’s Blog to get updated housing commentary, analysis, and information.


 Subscribe to feed


22 Responses to “Dissecting a County of 10,000,000 People: The Housing Demographics of Los Angeles.”
Kinda makes our little bubble here in Chicago/Cook County almost rational compared to LA county….
Dr. HB,
If I had the time and the resources, I would do one.
I know one thing for sure…
There are lots and lots of condos for sale in Chi-Town. They are even reducing prices! LOL….
Dr. HB:
I continue to be impressed with how everything is playing out almost exactly as you opined months ago. Just fascinating to watch it develop.
Fell asleep with the TV on Bloomberg last night (not a good sign) and when I woke up this morning, there was a fund manager of some sort who stated the following: “we believe the subprime problem is contained”.
Now, I gotta tell you, I wasn’t sure if I was dreaming, had fallen into the twilight zone and simply warped back in time. But, no, he was real. Talking about good deals in the financials, low p/e, LOL.
How in the world is this man handling hundreds of millions of assets of hard working people. What exactly is he doing all day other than appearing on Bloomberg. Has he ever even looked at the mortgage reset charts you’ve been posting all year?
Absolutely unbelievable, ignorant and close to criminal.
Oh, by the way, the “operative” words on the mainstream financial media and wall street talking heads is that there will be a “slowing” in the economy but no recession.
Pure talking points as I’m hearing it constantly now. These fools will still be bulls while picking up their food stamps.
Thanks doc for continuing to focus on the insanity that is the California housing market.
Sellers need to wake up from their dream world. Until that happens, there will be no rebound.
Doctor Housing –
Thank you for a great blog.
I live in Encino. Nothing is going on here in the Valley. They built this townhouse complex (24 units) actually quite nice but units are smaller than my two bedroom apt. They want $600,000 up to $699,000. I only see drapes in two units. The rest have been sitting empty since February.
Across the street they’ve built a luxury condo complex — nothing special. Starting price $799,000. They have just finished building them. Will let you know if anyone buys a single unit.
I walk in my neighborhood every day and I keep a very close eye on each house that is for sale and I can tell you that none of them have sold in the last 3 months.
Once again, love your blog.
Thank you.
@formul8,
Load up on the cash. There will be good deals in the years to come.
@thamnosma,
If you look at the cold hard data, you know where this is going. But alas, the delusion is still running rampant:
NEW YORK (Reuters) – IndyMac Bancorp Inc (IMB.N: Quote, Profile , Research), the ninth-largest U.S. mortgage lender, said on Tuesday it expects to hire as many as 850 former employees of bankrupt rival American Home Mortgage Investment Corp (AHMIQ.PK: Quote, Profile , Research) as it prepares for a rebound in demand for home loans.
A rebound? Who in their right mind is going to buy a home with these over inflated prices? Especially with all data indicating that we are in for a depreciating market.
I’m thinking that the best thing would actually be a half point rate cut. Nothing in the real economy will change when they cut the rate and by Christmas anyone happy about a rate cut will figure out that they were scammed.
Imagine if more people understood that the Fed is now powerless.
@formul8,
I know there are a few bloggers from Chicago here. I’d be interest in a similar analysis of the area.
All,
I didn’t realize California is now a red state:
Subprime Map
This is probably splitting hairs, but, personally, I am disgusted with the phrase or idea of “mortgage products”. To be presented with and select a type of mortgage loan as if it’s a “product” seems like sick marketing.
You can have this Ferrari (ARM), or you could have that Hyundai (30-year fixed).
Anyway, I view them as options, where you should evaluate the tradeoffs between them. In reality, you should just stay away from the ARM “product”. Yes, preaching to the choir.
I found it ironic in your timing of this post with the income data the OCR came out with today. Household income in OC rose to $70,232 from $58,820 in 2000. This is flat when adjusted for inflation and down 5.8% when adjusted for the SoCal inflation rate.
Hi Doc! Yes, I read your blog because you present a good/balanced assessment of an important market that I don’t know that well. And, you write pretty well!
I do believe that the number one player to come to the “resuce” will be the lenders/banks themselves. They simply will be forced (some willingly) into renegotiating better terms & conditions with their current borrowers, IMHO.
I buy like crazy in a recession:90-99
I sell like crazy when Hot:2001-2006
I will buy like crazy 2012-2018(est)
I will sell like crazy 2018-2022(est)
All the news, info., energy in reading & learning is known as clouds in the investment world. When the sky is falling (rain) gather assets. When the sky is clear (hot) sell assets. I learned this from Getty, Buffet, Howard H, my dad and uncle! Average profit is 1160% Gross on avg. Hold of 2 yrs.
It’s nice, but I would argue that median rent to median home price comparisson is irrelevant.
The reason is: most owner occupied are SF or larger condos, while rental appartments are mostly 1-2BR.
Finding a 3BR appartment is not easy, and the prices for those went up very sharply.
I rent a 3BR 1Bath in an old building. It was $850 in 1998, today it’s $1960, an increase comparable with the Real estate bubble. Of course, since it’s in the prime school district, the median price is much higher, something like $900K, but it’s still less than twice more expensive to own than to rent.
That’s probably because of a very high demand for rentals here from families.
Was this housing bubble created on purpose? And, do you suppose that purpose was to fool the masses into believing that they were in the middle class by putting them into homes? Even if they could not afford it?
Why would they do this? To quell the masses from protesting globalization and illegal immigration?
IOW, in our parents’ generation, they fought for good wages. Then they bought their homes with their paychecks, not exotic loans.
My favorite new CYA comment – the following was included in an appraisal I got today:
“The area is experiencing an upward trend in pricing. How long this will last is uncertain and could effect future value when markets equalize.”
Amazing.
“Like the article mentions, over 50 percent in the county rent.”
Really? How could that be if homeownership is a nose hair under 69%, an all-time high?
I believe the operative word is ‘county’ not ‘countRy’.
As in ‘LA County’.
@mrfnuts,
Thanks for clearing up that crucial point for Larry. Yes, the USA homeownership is at an all time record of approximately 70 percent thanks to lax lending standards. But LA County? Try digging into the Census number for yourself and you’ll find some interesting information.
The article clearly gives you an overview of key demographics, including homeownership rates for LA County.
@mike,
I wouldn’t say the median rental rate is irrelevant. Like the article mentions, over 50 percent in the county rent. So the median rent does play a role. We can easily say the median home price in Los Angeles is also irrelevant but it clearly isn’t. With Los Angeles reaching a median of $547,500, there is such a drastic disconnect between rental prices and home prices. Like you mention, if you were to buy that $900,000 with 10 percent down, your monthly payment would be somewhere around $5,900 at current market rates for jumbo loans. Your rent is $1,960 and the PITI would be $5,900, or a difference of $3,940. This is no small number. I would imagine if they raised the rent on your place to $4,000 a month it may impact your lifestyle.
In your case, renting makes much more sense.
@john,
I don’t think the bubble was created on purpose per se. However, I do think an environment was setup where quick riches in real estate was supported by a credit bubble. The Fed Funds rate being dropped after 9/11 to stop the very brief recession we had. Lax lending standards. And like every other past bubble, the fuel of greed. All these things combined and gave us the massive housing bubble we are in.
Keep in mind that the bubble is regional. There are other parts of the country where real estate is still fairly priced. But like everything in life, our immediate environment becomes the entire world. Now if you live in SoCal, this reality is the epicenter of the housing bubble.
@megan,
I’m not sure what they are trying to say. Prices are currently going up but they don’t know how long it will last when the market equalizes? So they are basically saying that prices are inflated so don’t be shocked when your home is worth 20 or 30 percent less.
All,
Finally a bailout that I can stand behind:
Unscrupulous lenders who deceptively sold subprime mortgages to millions of Americans should be fined and the proceeds used to help bail out borrowers facing a wave of foreclosures, according to Barack Obama, the Democratic senator running to be his party’s presidential candidate.
Full Article at Financial Times
If folks want a bailout then it only makes sense that those that caused this massive bubble should carry most of the financial repercussions. I know the industry is using “take responsibility for yourself moto” which is fine, because unfortuantely many people are and will be losing their homes through foreclosure. But what about those in the industry? Well if we were to let the system function without intervention, they would be dropping faster but this added liquidity is giving them some more breathing room. Where can buyers in trouble go in a credit crunch for $100,000?
It is the 2 standard system that is misguided. These companies are now asking for help because of their greed and lax underwriting standards. It seems like the Fed and some banks are willing to offer some corporate welfare. But those who bought at peak are out on the street if they miss their payments.
It’ll be interesting to see how they respond to a front running presidential candidate going directly after them.
I enjoyed this analysis, but I have a quibble with the charts you provide, as I believe they can be misleading visually because they do not all start at “0.” Just to use one example, the first graph about population growth visually “seems” to show a huge jump from 2002 to 2004, but it’s really *not* a huge jump, because the graph is only showing a 300,000 part of the total. Same with the median family income. However, you switch to a “0” base for the renters vs. owners graph.
Now, the *numbers* tell the same story, but the graphs visually distort the appearance. If the income and population graphs were on a “0” basis, the rise in population would seem more in line with your point.
Just a suggestion.
Leave a Reply