Housing in Graphics and California $16 Billion in the Hole: The Genesis of the California Housing Market.
When Californians say housing prices are insane and belong in a mental asylum wrapped up in a straight jacket, they usually are correct. Even as housing prices swiftly correct we are so conditioned to living with a bunch of crazies that many are actually starting to think current prices make some sense. This strikes at the relativity of how we associate things in our minds. When I arrived back in town after being in Manhattan for three weeks, I thought Los Angeles traffic was like a day at the mini golf course. Yet when I fly out to Texas and drive around the rural countryside and come back to Los Angeles, I feel as if my car is a can and I’m just one of the millions of sardines moving along the human conveyor belt otherwise known as the 405. Such is the way we view life. After seeing boxes sell for $500,000 we are ready to pounce like rabid hyenas on a home simply because it is listed for $350,000.
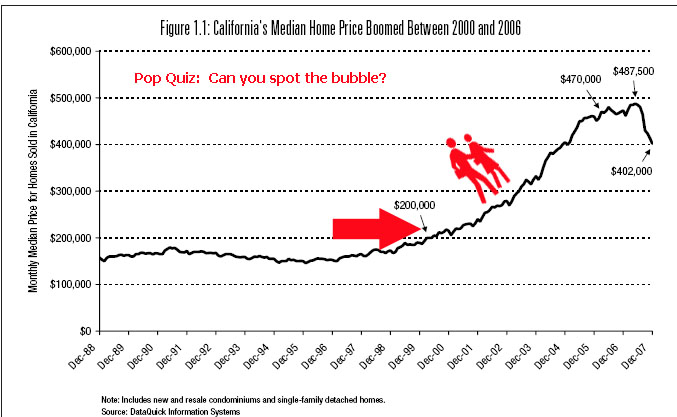
In this article we are going to examine multiple points regarding the state of California and point out that we still have a long way to go down. In fact, we are going to draw in new data points to further solidify the argument that buying a home in today’s market is simply the wrong economic decision. There is a long report called Locked Out discussing California housing put out by the California Budget Project that I highly recommend you read in its entirety. In this article, I’ll try to give you a brief summary of the 60 page report. First, let us examine a graph:
From 1988 to 2000, the median home price in California was relatively unchanged and a rather boring figure to examine. Now that we have the peak data point, we can start examining the entire wonderland scenario over 2 decades. For someone to purchase the median priced California home in August of 2007 at $465,000 would require an income of $113,162 while the statewide household income was $56,645; the price of buying a home with 5 percent down and a 30 year fixed mortgage was nearly twice the income that California households actually had. Looking at taxpayer records the median income for those filing jointly is $66,810 for 2006.
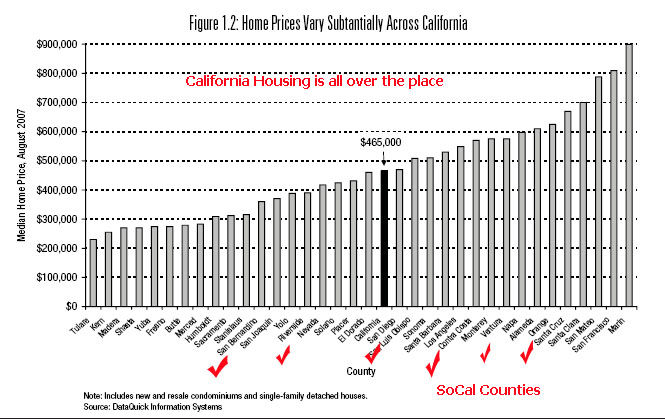
Even though we think Southern California housing is crazy we have nothing on Northern California:
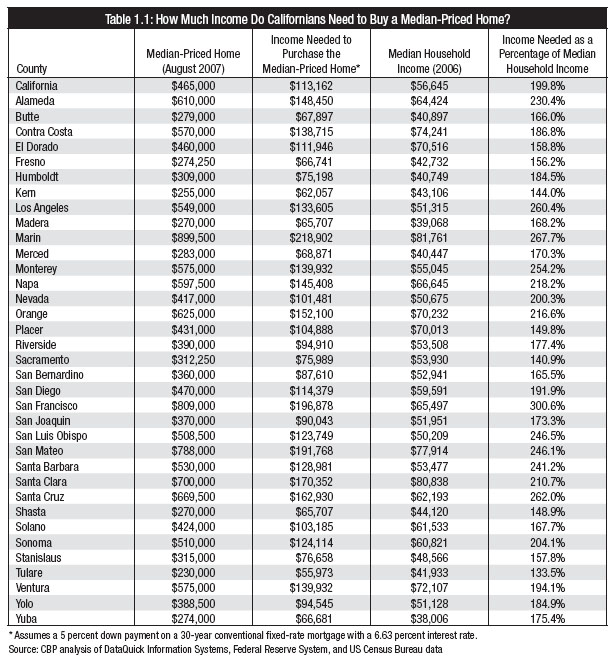
Take a look at how many counties in Southern California are over the median price home. Also, I’d like to point out that the data in this chart is from August of 2007 which was very close to the peak of California housing prices. Here Los Angeles was over $505,000 and the current median price in Los Angeles County is now $440,000. The variance in this one state is so extreme. On one end, you have homes with a median price slightly over $200,000 and on the extreme, you have a median quickly approaching the $1 million mark. If we break down the data further, not one county in the entire state has a local median income that can support the median priced home of that county:
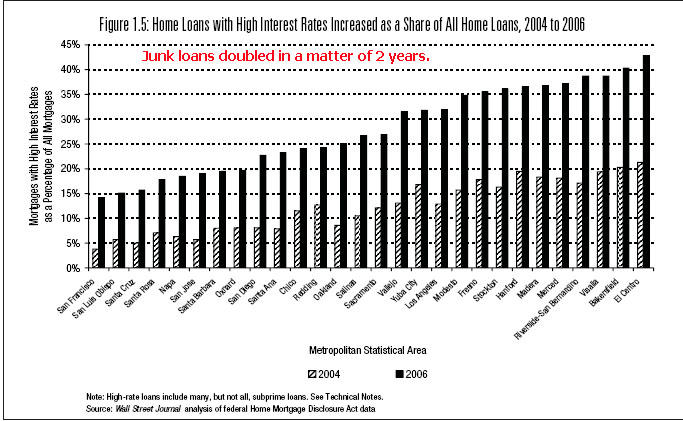
It is the case that in many places people are twice to even three times below the needed income to purchase a house with a modest 30 year mortgage! It is now becoming more and more apparent that all the exotic mortgage products were a way to squeeze people without adequate income into homes they simply could not afford. And we say this with actual data backing up this point because take a look at this information and you shouldn’t have any doubt why the market is now fiercely correcting. We need only look at the rise in banana republic loans during this time:
In some areas junk loans tripled from 2004 to 2006. Ironically this chart is almost a perfect inverse from the other chart showing the cost of housing in different California counties. What occurred is lower price areas had the highest level of fraud and flat out market corruption going on. In these areas craptastic loans were pushed on to folks that were already financially stretched too thin and had a very small cushion to fall back on. That is why we are seeing alarming foreclosures in the Inland Empire and also the Central Valley of California. Of course even so-called prime areas are now taking it on the chin but some areas are seeing foreclosures rates that have never been recorded at such a large magnitude. We relied on housing for jobs and also the health of the California economy to a large degree:
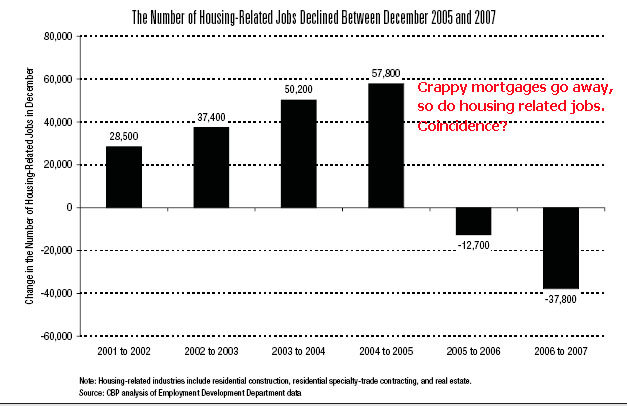
How coincidental that after the market started to decline and building started to slow we almost had a perfect decline in housing related jobs. Just take a look at the chart above. Housing related jobs will continue to decline this year. Keep in mind these were high paying jobs, which meant high consuming folks, which means good tax revenues. Now that these jobs are gone we lose the consumption and the tax base. This next chart is rather incredible:
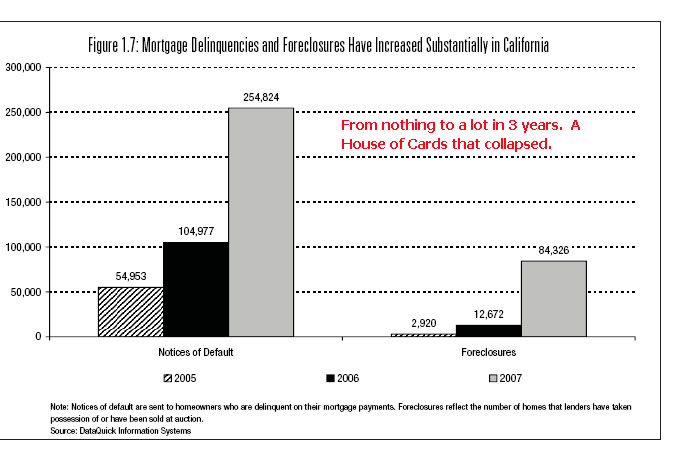
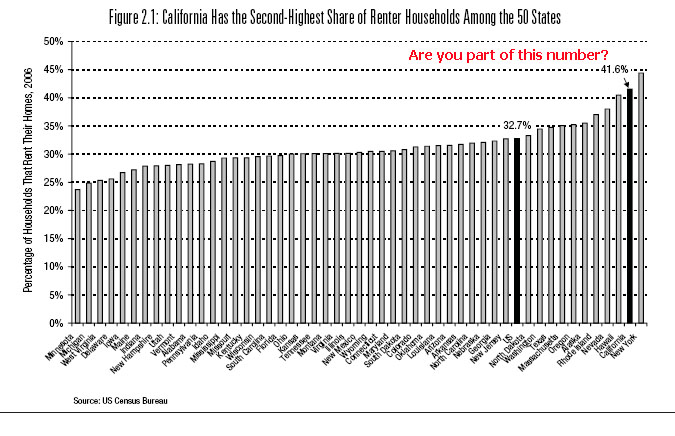
We went from 2,920 foreclosures statewide in 2005 to a whopping 84,326 in 2007! From nearly non-existent to a very big problem. Also, you simply need to take a look at the notice of defaults to give you an idea of how things are going to play out in 2008. There is no way we are near a bottom. Yet California is still one of the states with the highest amount of renters:
This shouldn’t come as a surprise given the absurd cost of housing in the state. The stunning statistic is that the state’s median priced home nearly tripled from 1989 and 2006 going up by an amazing 193.4 percent while the state’s median hourly wage increased by 60.3 percent and the state’s median household income went up by 67.6 percent. Let us not even get into the hammering of the U.S. Dollar. The reason you feel poorer is because you are. The cost of living has gone up while income gains have simply not kept up not even by any standard of comparison. How many times did housing outpace income?
Sorry Greenspan, I’d give you five bucks but my home equity line was just closed. Maybe you can kick me down with some of the profits from your new book; you know the one in which you talk about all the wonderful policies that you didn’t do? Now you tell folks to diversify into foreign currencies and how weak the dollar is. You came close and if you had it your way, we be at a zero percent interest rate policy and a home in California would cost $1 million and people would need to bring a wheelbarrow to their local bank if they ever needed cash. Of course Greenspan isn’t the main reason for this bubble but he was like the main conductor of an orchestra leading the American people in Credit Delusion in C minor. Fascinating opera that starts out slow and melodic, builds in the middle to a furious mix of sounds and insanity, and ends with a massive explosion. It’ll be playing for a few more years.
I’ve been sent a few e-mails from readers telling me that they have had a hard time getting withdrawals from their local branches. Given the withdrawals were in the few thousand dollar range, it really makes you wonder if people are starting to horde cash? I don’t mean placing it in a safe FDIC account but folks simply stuffing the money into the mattress. This isn’t likely an easy stat to measure but it will be interesting if we hear more about this.
Clearly the $16 billion budget deficit in the state is not going to improve. In fact, recent reports of housing show the decline only getting worse and accelerating here in the state. It looks like some areas of California are going to see 40 to 50 percent drops from peak to trough. This doesn’t seem like an unlikely scenario since many areas are more than half way there already. Count the job declines, the incredible budget deficit which guarantees further job cuts, the tanking housing market and you have for a very long 2008 in the Golden State.
 Did You Enjoy The Post? Subscribe to Dr. Housing Bubble’s Blog to get updated housing commentary, analysis, and information


 Subscribe to feed


23 Responses to “Housing in Graphics and California $16 Billion in the Hole: The Genesis of the California Housing Market.”
I think we will be lucky if the depreciation stops at 1996 price levels!
Cash, I have $5,000 in a lock box at home and in a safe deposit box I have 70 ounces of Gold and $15,000.
Next week I intend to add another $50,000 in the safe deposit box!
What is the worst that can happen, I don’t earn any interest for a year?
I call this the revenge of the the real estate gods! To all realtors that said property valued can’t go down, I had one response! “Do you know of an island where real estate crashed?” Of course they all said no! I said JAPAN! This is a replay, but maybe even worse!
I am sitting on one mill in cash waiting for the bottom. Of course, I know I will buy just a bit to soon! Figuring next summer, but the recession bottoms in 2011.
Unbelievable article, Doc, once again.
Just to show how deep in denial some people are look at this article from the front page of Yahoo this morning:
http://finance.yahoo.com/real-estate/article/104860/Is-It-Time-to-Buy-Real-Estate
My favorite part is the first few lines:
Investing in real estate used to be considered a “no brainer,” a can’t-miss investment. But these days, this sure thing isn’t so sure. Home prices keep falling. Standard & Poor tracking shows prices down 7.7 percent nationally in November 2007. The National Association of Realtors, or NAR, reports that sales of single-family homes were down by 13 percent in 2007, the biggest drop since a 17.7 plunge in 1982.Representatives of the NAR say that this makes it the best buyer’s market in a long time. Prices are down, interest rates are near a 45-year low and the supply of houses is high.
November 2007? Those are the statistics they use for an article in Aril of 2008? Are you freaking kidding me? Why not look at the stats for Jan. of 2004? Hell, by that metric this may be the best time EVER to buy a house.
NAR = National Association of Retards
Love the charts DHB. Thanks for the great info. We need to mail this one out to all the home sellers in California. Maybe then they can be more rational when putting their home on the market with a 2005-2007 price tag on it. I have a great idea for all current home shoppers, find a home you want to buy and staple this article with a 50% below asking price bid and see what happens.
I just did a back of the envelope calculation on Fig 1.7, showing the rising delinquencies and foreclosures. The rate is scary! In 2005, there were about 3000 foreclosures per 55,000 delinquencies—that’s 0.05. In 06 it was about 13,000 foreclosures per 105,000 delinquencies–that’s 0.12. In 07 it was 85000 per 255000, which is 0.33. What are we headed for?!
I keep most of my savings in a Vanguard Treasury money market fund at this time. That should be safe, right?
Jen –
Yes, VMPXX should be fine. It is at least 80% U.S. Treasuries and up to 20% agencies, no asset backed paper.
“After seeing boxes sell for $500,000 we are ready to pounce like rabid hyenas on a home simply because it is listed for $350,000.”
People are thinking houses are on the sale rack instead of realizing that they are really in the clearance bin.
Dr. HB, thank you, again, for a great piece.
In case you are wondering if the bottom is here take a look.
http://www.marcjosephrealty.com/Nav.aspx/Page=%2fPageManager%2fDefault.aspx%2fPageID%3d2082908
I say not yet……..
How far down can we expect prices to go here in Southern California? What is the lowest we can expect? 2000 levels? Even lower than that?
RE: Home prices vs. Incomes. Yes there is a direct correlation ( or should be) in most of California but not all. Marin County, e.g. benefits because a lot of people with money move there. When I lived there people like Sammy Hagar, Grace Slick and, for some reason, people from the porno industry lived there. SoCal has its migratory celebrities, heirs and heiresses too. I have no idea what Grace
Slick’s current income is but she made a good pile many years ago. The owner of the company my stepfather worked for, was based in Columbus, Ohio. When he retired he didn’t stay in Columbus but moved to Pacific Heights. In both cases
I suspect their investment income is substantial but maybe not enough to buy the homes they live in. Making a fortune ( or inheriting it) someplace else and coming to California to enjoy it is part of California tradition. Then there are the folks who just kept trading up or happened to have a home that became a multi million dollar property. There are substantial numbers of people in Marin, Pacific
Palisades, Newport etc. who never had flashy income but bought a house in those communities many years ago when they were not so expensive. Parts of Marin County, e.g. were working class communities not so many years ago. Palo Alto the same. Now their tract homes are/were worth a million dollars though they may have bought them for $40,000-60,000 30 or 40 years ago.
well looky loo what we have here, the “Einsteins” in the MSM are finally figuring it out.
http://articles.moneycentral.msn.com/Banking/HomeFinancing/AverageJoeStillCantAffordAHome.aspx
The average household can’t afford the average home.
But where’s it gonna end?
“If you want that single-family home, swing set and the American Dream, the reality is that in major metro areas, most of us will have to commute in order to enjoy that,” says Snaith.”
Well that’s nice but gas is flirting with $4 a gallon and may not stop there. How are you going afford that hour plus commute and a mortgage?
Omar,
I didn’t play this game nor noticed it really until last week. But I do like charts and to play with numbers. My personal guess is that this market will break through 1996’s lows, heading towards the late 1980’s numbers. I expect this to happen somewhere in the middle of the option arm reset cycle. I expect the Federal government will spread the pain out but after a while it won’t matter. My current guess for a median San Diego house is 287k within 2 years.
re: Comment by lee. Reportedly, after the 29 crash, no one was allowed to access their safe deposit box without an IRS agent present. I read that the banks have the same instructions today in case of GB declaring a financial emergency. Reportedly, page 16? of the homeland security act defines what coins have numismatic value and what coins do not. This may be relative to renewed gold confiscation.
You might want to investigate these items,,,, that is unless you have complete faith in the honesty of our GOV.
For those who are taking wads of cash to the Bank of Sealy and to safe deposit boxes.
What happens if there is an overnight ‘bank emergency’ a la Argentina, and the banks are all closed, healthy as well as sick, and certainly no access to the vaults where your safe deposit box is.
And then, further, what if when the banks reopen, we have to take our funds in a new currency, the old one being now illegal and outlawed.
The gold and silver will always have their ways of providing liquidity, but withdrawls from the Bank of Sealy might be good for use as asswipe only.
Just paranoid and tin foil?
I don’t know – look at how much of today’s reality was tin foil only a year ago.
All those realtard professionals, welome to bag my groceries.
Only probably the top 20% would survive in the industry, yeah right going around selling houses are professionals, I guess the same goes to hair stylist and locksmith.
Say DHB, can you elaborate on the “hard time getting withdrawals from their local branches” issue?
I hate to sound paranoid, but we’ve also grabbed a few thousand bucks to have on hand ‘just in case’.
What I don’t understand is how financial stocks go up when institutions release horrible earnings and are taking almost desperate measures to raise capital. Do people REALLY believe that the worst is past? Do people really believe this or, is this just a ploy to bring in sucker investors who will get killed as the next wave of defaults hit?
Jeez. I’m sounding like my old man now…cynical and suspicious. Sorry ’bout that.
@Matt:
I’ve noticed some of that logic now. You really have to be amazed at the spin that goes like, “things are so bad that come on, how can they possible get any worse?†If anything, some of the rally this week was based on that. Citi, WaMu, JP Morgan, and Merrill all did not do so hot. The good news with Google, CAT, Coke, and others seemed to be enough even though some of these companies warned of slower earnings. Two worlds here.
@Omar,
Looking at the data and trends I think we are still looking at a bottom in 2010 or 2011 at least for California. If anything, it seems like the official agencies are reluctant to call a recession probably until summer. The official definition is 2 negative quarters of GDP growth but we are definitely in a contraction. My guess is the next big shoes to fall are commercial real estate and state budgets taking hits this summer.
@js,
Gas isn’t helping those that bought homes in the Inland Empire and had to commute into Los Angeles especially those with fuel inefficient cars. Talk about a major double whammy. Plus oil is used for many things in life and with the PPI roaring and CPI holding out, what seems to be occurring is producers are eating some of the cost and are reluctant to pass the cost onto consumers. Of course food and energy go straight to the end user but Wal-Mart trinkets are still very cheap.
@Steve,
Because of fractional reserve banking it is the case that banks keep a limited amount of cash on hand at any given time. Of course, if you really think about it, how often do you deal with “real cash†otherwise known on the street as Federal Reserve Notes? You probably pay your rent/mortgage with a check, charge items on your credit card, and most likely get paid via direct deposit.
Of course with the FDIC, your deposits should be insured up to $100,000 per account but if an institution is failing and you have a large sum there, I’m not sure many know how easy it will be to access accounts. The few that e-mailed went to get funds in excess of $5,000 and of course, this is simply anecdotal. I’m sure given the nature of our government and their action they would simply rev up the printing presses and print greenbacks and increase the money supply before allowing this kind of panic to set in. After all, it seems like the American people are more focused on gas going up 10 cents a week while their dollar is collapsing and most don’t seem to care. How often do you hear the media talking about the crashing dollar?
Doc-
One other item I might add.
I work for an RIA that manages between 50-100B; I sat there today and listened and I heard the PM’s say that “earnings were positive” on financials(???) and they were going “overweight” in investment banks, starting today.
Interesting, I thought,
I then walked – calmly – back to my office, logged into my Schwab account, and dumped the following:
C+V, BK+E, RBS+H and JPM+J.
Why?
I just wanted out, and this – I think – is the closest I can ever get to getting out whole. If you are in the financials, in any way whatsoever, well, you better think the same way.
Remember that we have short term news coming up that – well, hell, break that.
How about some REAL LONG TERM news that should make your blood boil?
http://www.bloomberg.com/apps/newspid=20601087&sid=avUb49fO8dzY&refer=home
Yep , glad I dumped C+V Pfd today; real glad.
check out this blog to explain all the funny money
http://elainemeinelsupkis.typepad.com/
also see
fromthewilderness.com
solari.com
freedomtofascism.com
onlinejournal.com
globalresearch.ca
theoildrum.com
energybulletin.net
lifeaftertheoilcrash.net/BreakingNews.html
cheerio
DHB, First thanks for your info on Lakewood in a recent post. Much appreciated as are all the other detailed insights.
@CompaJD..”I have a great idea for all current home shoppers, find a home you want to buy and staple this article with a 50% below asking price bid and see what happens.”
I think this may be happening in my area. Until recently, for sale listings had prices starting in the high 400s-500s for mast homes. Today for the first time, we see a slew of homes listing in the mid-300’s.
Full Disclosure: I don’t have any bullion, and I’m definitely not sitting on ” One Mill” But what do have is some simple anecdotal evidence, do what you want with it.
Specs. 4bd, 2bath, 1200sq.ft REO in West Fullerton, currently on the market for 340K.
The house is needs about 10k in incidentals (paint, floors touch-ups etc) IN January of 2007 the home sold for a little of $500k. Since it hit the market less then two weeks ago its had multiple offers at and above listed price. Agents I’ve spoken to in the area are claiming that not only is interest heating up, but so are the contracts pens.
Where can one find sales figures to back these claims up? Has anyone else heard anything of this nature happening Fullerton?
Leave a Reply