There will be no U.S. economic recovery in the second half of 2010 – 13 charts showing weak housing trends, option ARM data, dramatic employment changes, and mortgage equity withdrawals.
Scouring the headlines from the latest dismal employment report, one can readily see that the second half of 2010 is going to tempt the double dip recession monster. This is to be expected since the solutions we should have taken back in 2007 of breaking up the banks and shrinking the finance, insurance, and real estate industry went by the wayside as financial lobbyists fought and won their ability to rob the taxpayer blind. So three years later, with the overall productive employment base of the country in disarray and housing still unable to recover, we shouldn’t be surprised if a double dip hits. In fact, we’ll look at 13 charts showing that a recession never really went away for most Americans. The exotic loans and lack of employment growth still ripple through the economy even as profits for banks are on the rise.
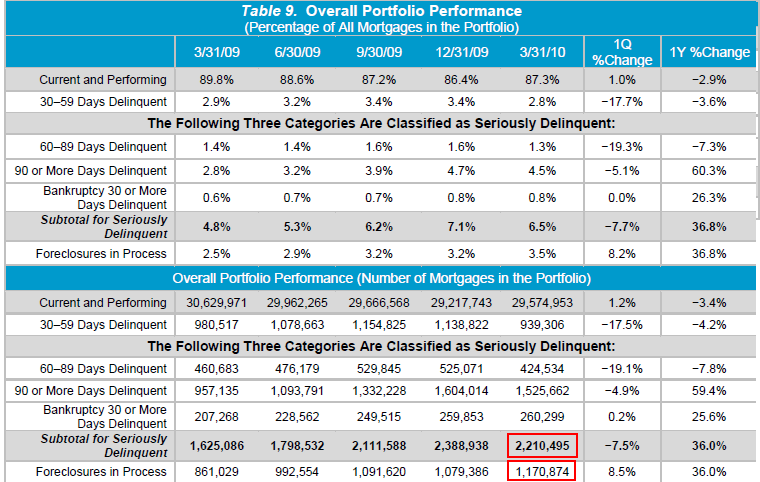
Chart 1 – Mortgage problems still prevalent
Source:Â OCC and OTS
This is an important chart because it shows that we are still at the peak of housing problems. The latest snapshot shows 1.17 million active foreclosures. Another 2.21 million loans are “seriously delinquent†and these are simply homes waiting to enter the foreclosure pipeline. The above report covers roughly 64 percent of all outstanding mortgages (34 million loans) so we know that there are actually more troubled loans out in the market. How is it possible to say things are better when the number of foreclosures in process is still at its peak? We have plenty of toxic loans that are still floating out in the market. As we have shown even million dollar homes are not immune to this correction.
A deceptive trend above is the 7.5% quarterly drop in seriously delinquent loans. This has occurred because of programs like HAMP that put troubled homeowners in a sort of mortgage purgatory. So this statistics is largely a shell game of the current way things are being measured. Even recent trends show that over half of modifications re-default at some point.
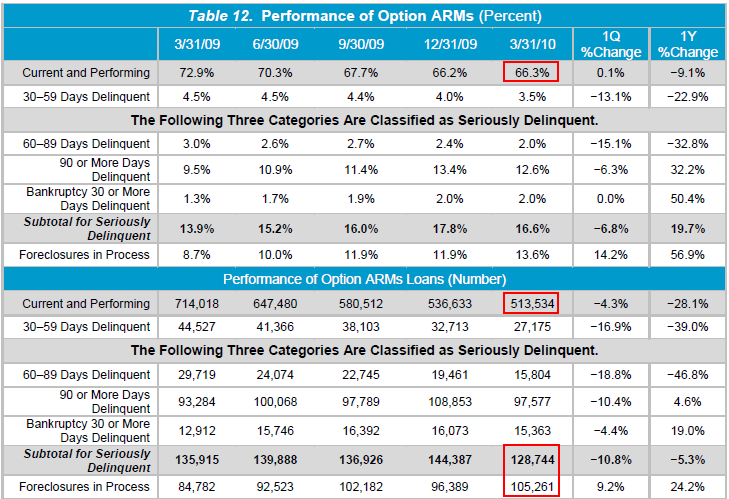
Chart 2 – Option ARMs
It is stunning that only 66 percent of all option ARMs are still currently performing. We know that banks have recently started shifting these loans into other mortgage products like interest only loans so the amount of actual option ARMs is shrinking. Even with that information, there are still over 500,000 active option ARMs. Over half of these are in the state of California. The above data is more case specific to a handful of states so I’m not sure how big of an impact this will have on the overall housing market. Yet many of the too big to fail banks including Wells Fargo, Chase, and Bank of America have plenty of option ARMs to keep them busy throughout the next two years.
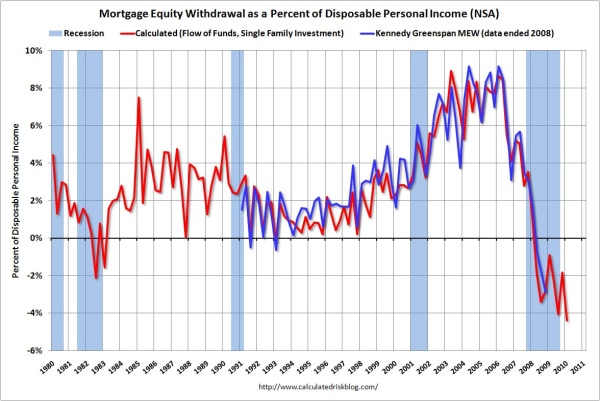
Chart 3 – Mortgage equity withdrawals
Source:Â Calculated Risk
During the boom years of housing to keep spending up, households were pulling out what came out to be the equivalent of 8 percentage points of their income from mortgage equity withdrawals. This stunning amount of debt allowed households to spend money even though incomes were stagnant. It was a debt fueled craze. Yet the above chart shows that game is now over with home prices down by roughly 30 percent from their peak nationwide. You can’t pull money from your home if you don’t have any equity. In fact, one third of all U.S. homeowners with a mortgage are now underwater on their mortgage. In other words they are in a worse financial situation than say someone that rents.
The above chart shows you what is happening but you can probably guess by the reduction of HELOC commercials and junk mail to your home that this housing ATM game is up. Given that MEW was a large part of spending for over a decade, where else are consumers going to get loans from? The banking industry is hoarding money just to fix their destroyed balance sheets.
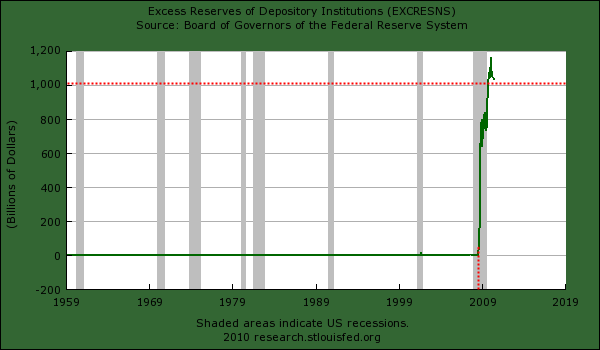
Chart 4 – Excess reserves
Source:Â Federal Reserve
Banks are holding onto bailout funds with both hands firmly clutched around hundred dollar bills like Scrooge McDuck. These are funds that would otherwise be in the hands of Americans. Yet banks realize the poor health of their balance sheets just like Japanese banks realized 20 years ago. So it shouldn’t be a shock that American bankers are motivated by the same self interest as their Japanese counterparts. The banking industry even today is largely insolvent. We all know this. The only way they have avoided full on dismantlement is by allowing for a suspension of mark to market, an unlimited lifeline to taxpayer dollars, and hoarding money for the coming problems with commercial real estate loans and the continued issues with the residential housing market. Banks have over $1 trillion in excess reserves. If the Fed wanted this money out in the economy it could charge banks for holding onto money. Then again, the Fed works for the banks so don’t expect that to happen anytime soon.
I’ve received countless e-mails from small business owners who own their own business and are no longer able to borrow. These are the employers of the country but don’t fall with the too big to fail crowd so their access has been shut off. We don’t need to look too far to see this in action.
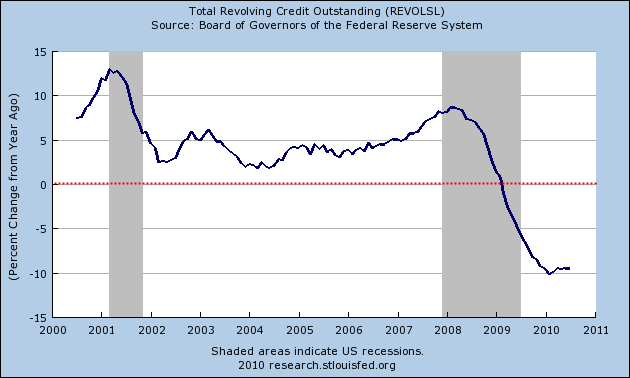
Chart  5 – Total revolving credit contraction
For the first time in data recorded history total revolving credit has contracted on a year over year basis. Keep in mind this has occurred at the same time that record amounts of bailout funds were transported over in big giant dump trucks to banks. It is an odd sort of system we currently have. Banks begged and pleaded and lobbied their way to bailout funds because they said they needed funds to keep lending open for working Americans. Yet once the funds were allocated, no strings attached (remember that Paulson three page memo?) banks went to fixing their internal problems while speculating in the casino known as Wall Street. Now, banks have this righteous notion that they won’t lend to Americans because they don’t have the income to back up the loans! The same banks that would be out of work today are now talking about lending standards.
The above chart merely reflects this absurd religion banks have now found. Most of us out in the economy realize that lending has tightened. After all, we are talking about the same industry that created the most toxic loans we have ever witnessed. Given 70 percent of our economy is based on spending and much of the spending is done with debt, it is easy to see the second half recovery as being nonexistent.
Chart 6 – Labor force
Source:Â BLS
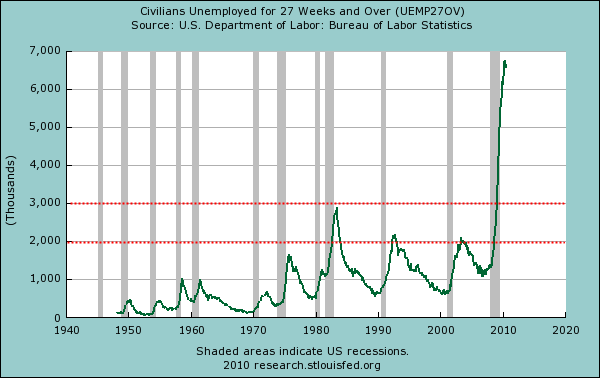
The market didn’t know what to do with the data released on employment. It reacted negatively at first because the headline showed a loss of 131,000 jobs for the month of July. But most of these were temporary Census jobs so it was okay and the market recovered most of the lost ground by the end of the day. Yet looking at the data closely, there was nothing to cheer about. The actual labor force shrunk by 181,000 and that is not good news. Yet somehow we are to believe that with a shrinking labor force things are going to be better in the second half? Just look at how pervasive long-term unemployment is.
Chart 7 – Long term unemployed
This is a much bigger problem than just saying we are losing jobs. Many of the jobs that are lost are simply not returning. These are structural issues that we need to deal with. There was a report showing that 4 out of 10 Americans work in low paying service sector jobs. So we expect someone working at Wal-Mart to boost housing values going forward? Not at current prices. We’ve never had so many workers unemployed for this long since the Great Depression. The same economists and bankers that missed the biggest recession in a century were now talking about a V-shaped recovery. There is now a Scarlet Letter on their profession and for very good reasons.
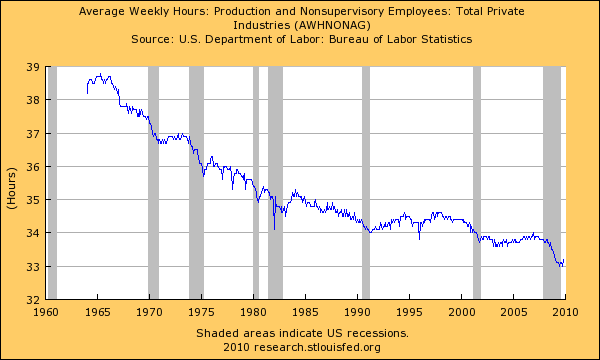
Chart 8 – Average weekly hours
I’m focusing a good part of this analysis on employment because this is the key to a sustained recovery if we are to have one. When we do see the economy turn around, you will first see it in average hours worked. Why? It is easier for a company to restore hours to current workers than to hire new people. Think of furloughs or someone that lost overtime hours. When things improve you usually see a minor jump in this chart first. Yet the overall trend is unmistakable over the decades. We are now seeing less hours worked on average as we become a large service oriented workforce. A transient group of workers now have very little job security unlike that of the previous generation.
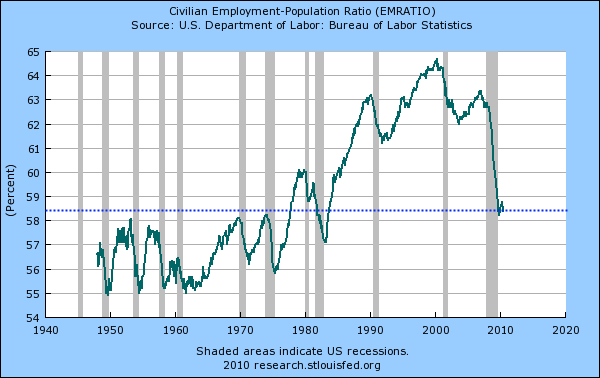
Chart 9 – Civilian employment ratio
The housing and banking obsessed FIRE industry doesn’t realize that the economy is still in major distress for most Americans. They view everything as a solvable problem from the banking end. Yet they are the problem. That is why for three years our main focus has been on shoveling money to banks and giving every imaginable incentive to prop up housing values. And what a shock that it hasn’t worked. Why? Because people pay for things with something they call a job! It is all about jobs. And we have made the incredible mistake of listening to bankers for advice on how to solve this crisis. Upton Sinclair had it right:
“It is difficult to get a man to understand something when his job depends on not understanding it.â€
Just look at the above chart. Our current employment ratio is on level with the deep recession of the 1980s. We have a long way to go before claiming any sort of recovery.
Chart 10 – Consumer sentiment
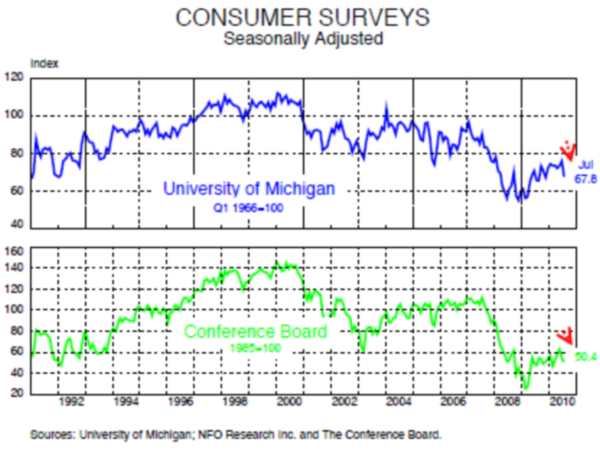
With all the above data it should be no surprise that consumers are a bit pessimistic when it comes to the current economy. The two most widely cited consumer surveys show a very weak response. These sentiments are like reading tea leaves but they do reflect something that we all know. Outside of the stock market, there has been very little of what we can call a recovery. Just look at the state budget crisis spreading across the country. Unlike the Federal government, states don’t have a printing press to simply make money out of thin air. They have to contend with reality and what money they do have.
Chart 11 – Consumer price index
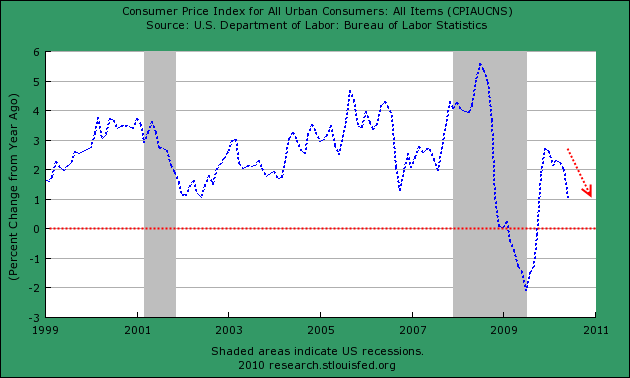
One question I often get is how can it be with so much money being printed that we are not seeing any sort of inflation. First, we now live in a world where debt is equivalent to money. Since the peak household wealth has contracted by $11 trillion. This has occurred through foreclosures, bankruptcies, and business failures that have come from the bursting credit bubble (aka money destruction). The money that was used for bailouts was given directly to banks and as we have pointed out, banks have hoarded the money. So this money isn’t finding its way to the hands of consumers.
That is why in the above chart, you see consumer prices trending more toward the side of deflation. Short of the government sending $100,000 checks to each American household, there is little short term pressure for inflation. With that said, there is likely more chance of home prices falling. We are looking more and more like Japan in our actions and 3 years into the crisis, we now have a good amount of data to look over.
The story in Japan is starting to sound familiar here:
“(Daily Finance) The media in Japan have popularized the phrase “kakusa shakai,” literally meaning “gap society.” As the elite slice prospers and younger workers are increasingly marginalized, the media has focused on the shrinking middle class. For example, a best-selling book offers tips on how to get by on an annual income of less than 3 million yen ($34,800). Two million yen ($23,000) has become the de-facto poverty line for millions of Japanese, especially outside high-cost Tokyo.
More than one-third of the workforce is part-time as companies have shed the famed Japanese lifetime employment system, nudged along by government legislation that abolished restrictions on flexible hiring a few years ago. Temp agencies have expanded to fill the need for contract jobs as permanent job opportunities have dwindled.â€
Part-time employment, something that has grown in this recession is likely to stay around. These workers will not be purchasing homes especially not at current prices or high cost automobiles. A shrinking middle class is simply not good for our economy moving forward.
Chart 12 – Home sales
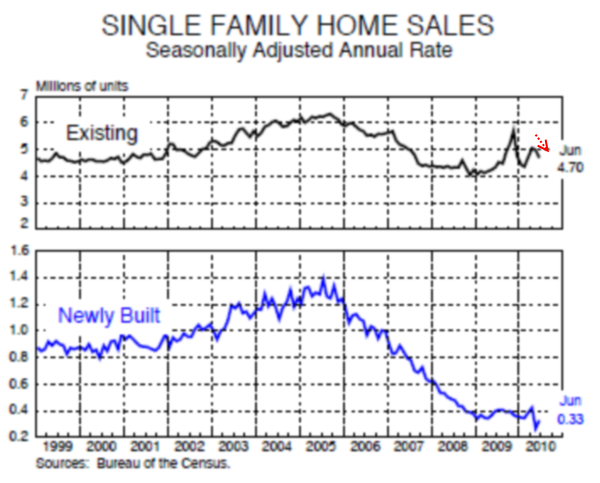
The above chart should come as no surprise. Home sales nationwide are weak. There is little demand for new home sales. The only thing keeping existing sales brisk is the large amount of lower priced foreclosure re-sale inventory. But actual recoveries come when the gap between new home sales and existing home sales narrow. And this makes sense. You put people back to work when you are building through construction and all additional items needed to furnish a new home. Yet we have built enough homes for years to come.
I’m amazed that with every possible gimmick home sales are still weak:
-$8,000 home buyer tax credit
-Fed buying up MBS to lower interest rates
-Favorable tax deductions for homeowners
-Punishing savers by forcing interest rates lower
-Encouraging low down payment home purchases with FHA insured loans
Actually, there isn’t much to be shocked about. The one key factor, employment is horribly weak. We’ve spent so much time listening to the FIRE side of the economy for solutions that we are now in this quagmire. We need only look at the employment trends and realize this is no typical recession.
Chart 13 – Employment growth
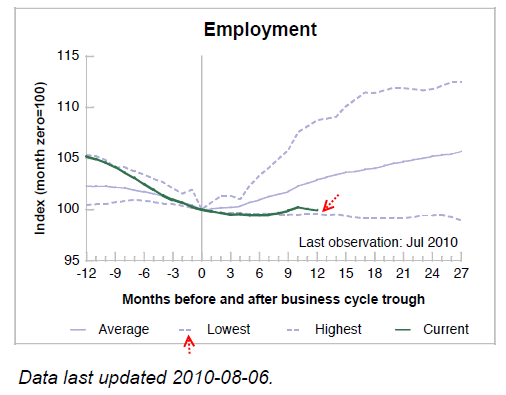
We are tracking historically with the worst of the worst business cycles. This is the deepest recession since the Great Depression. By this point in the Great Depression the banks were being shackled by their feet and being broken up between commercial and investment banking. None of that has happened this time. Also, the government even then had a focus on employment growth. What have we done this time that is strategic? Fortunate for us (I suppose) is that we are in 2010 and we have a Census going on to hire people for short term work. You can imagine the employment data without this. But what strategy have we taken since the recession started back in 2007 to focus on employment growth?
The solution is simple in theory but the politics make it near impossible. Break up the financial industry. In fact, it should be easier today because they now have a buffer of funds to restructure thanks to taxpayer money. Stop favoring real estate as the champion of all investments. The market is trying to correct this imbalance by lowering home prices because this is what the current economy can support. Yet banks keep doing everything possible to keep prices inflated for their profits. If banks are only lending government backed money do we need the sea of bankers we currently have? The solutions are rather clear but we are not following in that path. Those in the industry can’t see beyond this. The FIRE economy is too big. We should focus on engineering, infrastructure, education, and at least in these industries the net gain to the public would have been visible. What gains have we seen this time? What should you expect from an industry that brought us collateralized debt obligations, mortgage backed securities, option ARMs, and every other toxic debt product intended to suck the actual productivity right out of the economy. Second half recovery? Not with the current structure in place.
Did You Enjoy The Post? Subscribe to Dr. Housing Bubble’s Blog to get updated housing commentary, analysis, and information


 Did You Enjoy The Post? Subscribe to Dr. Housing Bubble’s Blog to get updated housing commentary, analysis, and information.
 Subscribe to feed


43 Responses to “There will be no U.S. economic recovery in the second half of 2010 – 13 charts showing weak housing trends, option ARM data, dramatic employment changes, and mortgage equity withdrawals.”
your analysis is spot on, it seems like nobody will act until the sheriff comes to throw out his furniture in the street. and with the govt pushing rewards for the worst of us, the thrifty, hard-working sorts are going to be the ones who see the sheriff coming to take their homes away.
the remedies were easy enough to see but politically painful. now, b/c we refused to adopt them, we are going to see even worse pain, maybe explosion
It’s not entirely true that, at this point in the depression, gov’t had been actively promoting employment.
One of the misconceptions about Herbert Hoover is that the man did nothing. He said some fairly laissez faire things but the reality of his actions was quite different. He did quite a bit. Unfortunately, much of it was disastrously wrong. He signed the epically stupid Smoot-Hawley tariff bill that set off trade wars around the world and worsened economic conditions across the globe.
But previous to the Great Depression, the way businesses dealt with downturns was by cutting wages. For whatever reason, Hoover was adamantly opposed to this and, instead, promoted an array of policies to keep wages as high as possible. This result was to significantly worsen unemployment.
If Hoover really had done nothing it probably would have been preferable.
If we’d let the sacred “too big to fail” banks fail, it’s at least a matter for debate as to whether we would be better or worse off.
On the subjects of tariffs there is a LOT of misconception. The popular chant is “Tariff bad, tariff bad, tariff ALWAYS bad.” And that is incorrect.
Tariffs are bad IF you are a creditor nation. Tariffs are bad IF you are a net exporter nation. This is because if you don’t let other countries sell you their goods and merchandiase, they can not pay back their debts. This is because if you enact a tariff the countries to which you export will retaliate and enact tariffs against your goods.
Tariffs are good IF you are a debtor nation. Tariffs are good IF you are net imprter nation. If you are a debtor nation and enact tariffs, you stop the drain of your money out to countries from which you buy goods. If you are a net importer nation and enact tariffs, you stop the import of goods and force the creation of goods within your own borders thus stimulating your own manufacturing and economy.
Now if you are a flat-worlder, open borders, global free trader type you will always hate tariffs (even when they are in the best interest of your own country.) That is because your concern is for other countries rather than putting your own first.
In 1930, the US was a creditor country AND a net exporter country. In that instance, the tariffs HURT the US.
In 1930, England was a debtor country AND a net importer country. In 1932 the UK impose a 10%+ tariff on all goods excpet those coming in froom within the British empire. This stimulated domestic production. Consequently the UK was less severely effected than the US AND came out of the slump sooner.
BTW, you way way over-estimate the impact of the 1930 US tariffs on the rest of the world during the Great Depression. The UK and its Empire, as a marke for other countries, was far far far more important. Smoot-Hawley did NOT cause the global financial collapse nor have that much importance internationally – after all the US a net exporter, not importer and the other countries simply defaulted on their war debts to the US as the 1929 global financial crisis spread.
You’re going a little overboard with your criticism when all I said was that the Smoot Hawley tariff “worsened economic conditions across the globe”.
If you want to argue that it didn’t, you’ll have to take on just about every economist of every kind.
Why do people go over the top with criticism, pretending that someone said much more than they actually did to attack it? Does it make them feel smarter?
And I hit send accidentally. You also write ” the Great Depression, the way businesses dealt with downturns was by cutting wages. For whatever reason, Hoover was adamantly opposed to this and, instead, promoted an array of policies to keep wages as high as possible. This result was to significantly worsen unemployment. ”
Do learn the difference between a business cycle economic downturn and a collapse in demand economic downturn. 1929 (and acutally eriler) was a collapse in demand becuase Jake and Tilly didn’t have enough money to keep spending. They didn’t have money because (a) their incomes hade been flat or falling since WWI and (b) they had discovered this new-fangled idea of ‘buying on time’ aka credit. (Does this sound familar?)
Cut wages in a collapse-of-demand downturn and all you do is make it worse since now Jake and Tilly will have even less to spend.
If you need a concrete example, look at the Long Depression which primarily was a trans-Atlantic financial crisis with a concommitant drop in demand beginning in 1873. Employers cut wages and it dragged on for for over 23 years in the affected nations. (It is dated only for 1873-1879 but the effects were felt until after 1901.)
CUtting wages during a drop-in-demand downturn is FLAT STUPID. Been there, down that and it D-O-E-S N-O-T W-O-R-K.
That’s a fine argument, except that it ignores the reality of a lot of situations and presupposes one answer to a problem where there was another and we could debate whether the other solution would have worked better. Let’s imagine you’re running a mill in 1930, perhaps making textiles in the south. They were mostly gone from here in new england by that time.
Economic activity declines and demand for your products drops. You only need produce 3/4 as many units as just a year or two before. You have 160 workers employed at your mill. You’re automatically assuming that you, the mill owner make an economically superior choice in firing 40 workers and having the others working just as many hours as before. Maybe so, but maybe not. Is it so clearly and intuitively obvious that it’s a better choice than having everyone one a roughly 30 hour per week schedule and not firing anyone?
Your response almost seemed to presume away part of the situation. The mill owner’s only got so much money coming in and so much that will go out to workers. Contrary to your apparent assumption, this is not a case of money somehow being withdrawn from the economy but rather a case of its distribution. Maybe you didn’t pick up on that. But it’s quite reasonable to argue that 160 workers making less money is better for society as a whole and the economy then 120 workers making the full amount they did before and 40 workers unemployed.
Communication on the internet can be courteous and interesting and even someone like yourself can learn something or at least encounter interesting and differing points of view.
Well if cutting wages doesn’t work, why don’t we make the minumum wage $700/hr and solve all our problems?
Of coarse it works, lower wages = lower good prices = increased sales activity for the same demand = increased production and economic activity
You REALLY CAN’T handle beiing called on your over-statement and mis-statements can you? Disagree with you and point out th errors and you go nuts and scream that it is rude. Ever sought help for being hyper-sensitive?
Suggest you go learn about the subject. (BTW, my one degree is a specialty in the political, social and economic history of the 1930s.) Start with “Freedom For Fear”. Move on to some of the better economic histories of the events in the UK. Might even try “This Time is Different.” And there are some excellen histories of the economic events from mid-1800s to date – that is where you willlearn about the Long Depression. (I had a fantastic original source on that time – my great-grandfather who was in his late teens and then 20s throughout.)
And you seem to not have a good grip on the reality of greed. You write
“You have 160 workers employed at your mill. You’re automatically assuming that you, the mill owner make an economically superior choice in firing 40 workers and having the others working just as many hours as before. Maybe so, but maybe not. Is it so clearly and intuitively obvious that it’s a better choice than having everyone one a roughly 30 hour per week schedule and not firing anyone?”
(1) The employer who cuts wage rates will immediately put the money in their pocket. They will not hire more employees. (And you ONLY said “cut wages” and nothing more.
(2) If you have 160 workers doing 40 hours a week and you only need 40 workers doing 40 hours a week, something has to give. Cut all 160 workers back 10 hours a week and now you have 160 households that can not pay their bills. There is a point at which redistributing the remaining hours of work among all employees helps no one and hurts everyone.
(3) The FLSA was originally designed as a means of redistributing the hours of work (40 hours max or pay overtime) while puttiing a floor under wages (minimum wage. ) Problem is the wage floor is way way way behind the rate of inflation as it is,
So if you make the work week say 30 hours, then there would need to be a corresponding increase in the minimum wage for workers to stay even. $7.45 an hour even at 40 hours of work means public housing and food stamps as it is. Now cut that 25% and it is even worse.
Not much to cut in terms of total income for most workers when their median income is around $33592 a year. (Median hourly wage x median hours worked per week x 52.)
I’m not sure that I should bother correcting you and pointing out insular obtuseness of your posts but I’ll try.
It’s nice that you got to talk to your great grandfather about conditions in the 1870’s and beyond. But as a sample of economic conditions of the time it’s nearly meaningless. I grew up in a small town in Massachusetts in which the American Optical company was headquartered. According to him and a couple of his contemporaries, the depression barely touched the town at all as people still had to buy eyeglasses and AO, as it was known in the area, sheltered the town from the storm much very well. If I was foolish enough to regard one testimony as indicative or representative of conditions experienced by, perhaps, a hundred million people I wouldn’t be thinking very clearly, would I?
You then say, in response to my very simple scenario illustrating how promoting higher wages and accepting greater unemployment might not be better than accepting lower wages that:
“(1) The employer who cuts wage rates will immediately put the money in their pocket. They will not hire more employees. (And you ONLY said “cut wages†and nothing more.”
Where you got the notion of more employees being hired is beyond me. I mentioned no such thing and it’s not implicit in anything I said. That’s a complete misreading. Then you go completely off the rails.
“(2) If you have 160 workers doing 40 hours a week and you only need 40 workers doing 40 hours a week, something has to give. Cut all 160 workers back 10 hours a week and now you have 160 households that can not pay their bills. There is a point at which redistributing the remaining hours of work among all employees helps no one and hurts everyone.”
I tried not to belabor the point but it was absolutely clear that I was comparing 120 workers working full time (40 hours per week) versus 160 workers working about 30 hours per week. Where you came up with only 40 workers being needed is beyond me. You seem to have invented that out of whole cloth. Sometimes, if you think no one but you knows anything at all and have made incredible errors of logic, you should question whether you understood them correctly. This was one of those times. But your last sentence in that paragraph is reasonable and actually the crux of the argument. I suggested that Hoover’s promotion of high wages and, implicitly greater unemployment was bad. As you indicate in this sentence, the opposite response can only be carried so far before it, too, creates deleterious effects.
As to the remainder of what you say, it’s unclear why you bother to try to sneak in the implication that everyone is at minimum wage and bother with what today’s minimum wage is. I didn’t advocate this as a universal prescription. I simply replied to the notion in the post that the U.S. gov’t had done much more to address the issue of unemployment at this same stage of the Great Depression. Some of what was done actually increased unemployment.
And, as an aside, I printed out each of our successive posts and showed them to a woman in our office, an acquaintance rather than a friend, to see if she thought I was being too sensitive. She thought you were very funny and chuckled, “Wow, talk about the pot calling the kettle black.”
Some of your posts on this site are quite interesting. I hope to read more like those in the future.
I really am beginning to wonder about the conventional wisdom of the Smoot-Hawley tariff worsening the economic conditions around the world. It seems that, now, as well as then, the economy was going thru wrenching dislocations due to deleveraging and that it is quite difficult to separate the effects of all these peripheral factors in the face of that.
As a corroboration of your advice that the financial industry be broken up, I believe the numbers I’ve seen were that, circa 1965, the financial industry constituted about 4% of U.S. GDP. But now it’s around 8.5%. If they were really providing previously unavailable benefit to the economy, that would be one thing. But one can’t help but suspect that Government Sachs, Morgan Stanley et al are simply sucking financial oxygen away from other parts of the economy.
The banks are not hoarding money! They are doing what they were told to do with it. Wall Street directed Washington to funnel large amounts of taxpayer dollars (present and future) to banks with the (implicit!) understanding that they would use it to enrich those who arranged for it to be sent. Churn and investment advice income is maximized, as anyone would expect. What could be more obvious? Facades about using it for job loans are just that.
Most of the increase in employment comes from small businesses, not large ones.
Small business is the engine that drives the economy.
Unfortunately, most small business is doomed in this double recession.Besides the downturn in business, here are some of the taxes/fees that they face.
Federal income tax
State income tax
Property tax
State Corp. tax on gross revenues (seperate from income tax)
City tax on gross revenues
County tax on personal property(desks, compturers, copy paper, etc.)
State Corp. annual license
City Business license
License fees if you are required to have a professional license(real estate, insurance agent, etc.)
You would have to be INSANE to start a business right now. Over the next two years, many existing businesses will throw in the towel. They have no choice.
You forgot one thing Doc, high gasoline prices. High gas prices in an economy that is on critical life support is just another daily body blow to it. Gas prices should be now down to less than a $1 a gallon, yet, it is almost $3.50 a gallon here in Los Angeles and rising.
There is a chart that shows that crude oil prices are exactly in sync with Dow Jones Index. Since Crude oil is traded in Dollars, the price has to be high, in order to prop up the stock market. Save the big investors but screw the small man. Unbelievable!
Thanks Doc,
As you repeatedly repeat – it’s all about employment.
I think you’re work is amazing Doc. I know people are confused, but the crime families have used the same tactics all through history to grab control of the banks, legal system, politics, military, religion, insurance, without putting their faces out. They don’t care about us. They send us off to war. They are bleeding us to death while they glorify themselves with bigger and bigger monuments to their greatness. This is how most societies collapse. They may have killed the golden goose this time.
Currently, Obama is trying to pass another 26 billion dollar stimulus package to move the housing market in this country. When will he listen to the people and actually change course and focus on job growth?! It’s sickening to hear him playing the blame game on TV with no game plans to add jobs to the private sector.
@yan
If this stimulus package passed, how would it move the housing market? Or,
how do they hope it would move the housing market?
Sorry to spoil your political knee-jerk rant but the $26,000,000,000 just passed is to go to the states for Medicaid, teachers, police fire etc.
Does help to find out the facts before going off on a politically dirven diatribe.
Correct. Its intended to hand out future taxpayer’s money to save current government union jobs.
Ann, I usually enjoy your writing, but the latest rant appears to be the pot describing the kettle with politically-motivated rants. You decree a number of axioms and postulates without citing why your sources or opinions are right while everyone else is stupid and wrong. Right or wrong, I have never read anything to dispute the damage caused by compnounding protectionist tarrifs. It seems obvious that raising tarrifs on your trading partners reduces their ability to trade with you and hence decreases exports to them. Their retaliation further discourages your exports to them.
I also take issue with your assertion recently that state workers are not overcompensated relative to the private sector. In todays paper I read that over the last nine years there has been a huge disparity in increased compensation to government employees relative to the private sector.
I appreciate your input and obvious knowledge, but can we have a discussion rather than a reprimand for being ignorant? Nobody knows it all, but we’re all trying to understand what the hell is going on.
Yes, yet again the government rushes to rescue their own and protects the sacred teachers, and….”first responders”
Both of these groups have had huge amounts of taxpayer dollars shoveled at them during the last decade, and have never had to adjust to any economic downturn.
Fact is, until recently, in every recession, the three groups that almost always added jobs in spite of any economic logic were government, education, and health care (which said government transfer payments to will also eventually bankrupt us)
And the daily spin is how they are saving “hundreds of thousands of jobs” with this ridiculous addition to the debt.
But it is painful how they do not flinch to save government jobs, but do nothing to save any private sector jobs. Nor should they. But to pick and choose and cause even further distortions is another example of bad government gone worse.
Dark Ages
August 10, 2010 at 3:56 pm
Ann, I usually enjoy your writing, but the latest rant appears to be the pot describing the kettle with politically-motivated rants. You decree a number of axioms and postulates without citing why your sources or opinions are right while everyone else is stupid and wrong. Right or wrong, I have never read anything to dispute the damage caused by compnounding protectionist tarrifs. It seems obvious that raising tarrifs on your trading partners reduces their ability to trade with you and hence decreases exports to them. Their retaliation further discourages your exports to them.
I also take issue with your assertion recently that state workers are not overcompensated relative to the private sector.
___
Go back to some econ treaties that are pre-Friedman and/or not tainted by the Chic School or the global traders. I recommend histories of the economic events in Enlgand, Reinhaard & Rogoff, etc. For current events there is a reason that China has huge barriers to imports but exports like mad. They are not illogical – they are simply putting into practice the maxims I outlined, China is an net exporter ad creditor nation.
SOurces? Well if you want I will happily ship to you, at your cost, my econ textbooks from college and grad school. The masses have been brainwashed into believing the free-trade global trade nonsense without having been educated as to why other methods (tariffs in some instances) are good and in other bad and what the consequences of global markets are for an importer-debtor nation.
The historical numbers are the hisorical numbers – nothing wrong about that and it sure as bejesus is NOT political!
I suggest you get your info on the pay of public employees somewhere besides the anti-blogs and news channels.
This data is state & local public employees vs private.
(1) As a class pulbic employee are far better educated than private.
8.9% of private employees have an MA or better. 23.5% of public employees have an MA or better – or 264% more.
20.9% of private emplyees have a BA or better. 27.4% of public employees havea BA or better – 31.1% more.
HUGE educational gap between the 2 groups
(2) Public employees are older. Median age of privat employees is 40 and of public 44. Public workers have been, as a class, doing their jobs longer.
SO the public work force is more and experienced and a LOT more educated than the private.
When pay comparisons data are adjusted to allow for the (1) more experience and (2) far more education, public sector workers come out WORSE off than their counterparts with the same level of education and experience. In short, the public workers make, on average. 4- 6% less than someone with the same experience and same educational level.
http://www.cepr.net/documents/publications/wage-penalty-2010-05.pdf
Like I have sais, do you really think you are going to get someone with an MA in math to work for $10 or $15 a hour to teach your rugrats algebra?
Lost Decade: Must See Video 🙂
http://www.youtube.com/watch?v=udT3dbbryEU&feature=player_embedded#!
Your analysis is spot on! I live in southern California and just today read that the price of houses are going up (celebrate–ring the church bells–recovery is here–Obama is king!).
I don’t understand how the mechanics of how house prices in San Diego can continue to rise because I’m not an economics ‘expert’, but I do know wonder–HOW CAN PEOPLE CONTINUE TO BUY THESE EXPENSIVE HOUSES WHEN THEY DON’T HAVE JOBS??? Even in California not everyone is a doctor or a lawyer or a filmmaker. Common sense dictates that all this is just misplaced optimism. It’s not sustainable, folks. I’ll say it again, this time slower. It’s…just…not…sustainable!
Gail, you may be overlooking the significant number of active and retired military households in San Diego, all tapped into the federal $$ teat. There is also a historical stream of buyers from S. America and the PacRim countries–new Chinese millionaires always need a pad OUTSIDE of ChiCom-land.
A similar “floor” of housing price support is being seen in the Denver MSA, which has the largest concentration of Fed.Gov workers outside of DC.
Though “everyone a gov’t drone” is not sustainable (see USSR), it can go on for a LONG time (see USSR). ;’)
@Gail,
While most of us are in limbo, there are huge amounts of phantom/fiat dollars sloshing around the globe. I can’t say with certainty, but with a smaller sample, a few sales can move the markets. Not everyone is broke, just 90% of us. China’s $4T stimulus package should not be discounted. Certainly not the Walmart greeters buying homes in SoCal, that much I’m certain of. These cronies have become expert at manipulating statistics for rhetorical purposes.
The United States is in the early stages of slow motion economic collapse ala Japan, housing prices will never recover to peak 2007 levels, instead they will grind down lower and lower untill the United States suffers a second financial crisis ~ 2015 or so, resulting in an Argentinian style implosion and anarchy. What will rise from the ashes will be the United States of Mexico. America Too Big Too Bail, Too Broken to Save.
Excellent article. What we have is the problem of Too Much Debt. No matter what happens tomorrow (the Fed) it’s going to take a long time to work that debt off no matter what screwed up remedy they come up with. You can forget growth in big-ticket items. Mr. market is destroying money faster than the Fed can print it. I am working on a refi from a jumbo to a conventional mortgage. I can get 4 1/8 for 30 years (pre-approve 15 day lock). The return on the money I am paying down the mortgage with works out too close to 13 1/2%. By paying back the bank I am reducing the money supply. Think about all the people who are paying down debt and counteracting the Fed. Just add one more graph to your article. Consumer Metrics daily growth chart. It’s dropping like a stone. It shows a 4 1/2% contraction of the retail economy.
real estate Web site Zillow.com said on Monday.
AP
——————————————————————————–
Fewer homeowners with so-called underwater mortgages — where the amount owed on the mortgage exceeds the home’s value — is nevertheless a positive for the housing market as it could portend fewer defaults and foreclosures down the road. The percentage of American single-family homes with mortgages in negative equity fell to 21.5 percent in the second quarter from 23.3 percent in the first quarter and 23 percent a year ago, according to the Zillow Real Estate Market Reports.
“While some of the downward pressure on negative equity is coming from stabilization in home value trends, the larger factor is the enormous volume of foreclosures occurring within the stock of homes in negative equity,” he said.”Since national home values are projected to continue to fall until later this year, this will keep negative equity rates fairly high,” he said. Additionally, for more than one-fourth, or 26 percent, of home sales nationwide, the home was sold for less than what the seller originally paid.
Gail M,
Unfortunately, there will be pocket areas in California that will hold up in value and will be out of reach of middle-class locals. People from all over the world that now produce more than Americans and lack debt will quickly snap up properties with superior school districts or located in coastal areas. There will be exceptions, but very few. Whether it be Cerritos, Coronado, Arcadia, etc. These pocket areas will probably see not much of a price drop like the last recession. Just look around; there are very few jobs left here that generate healthy income no matter what your education level is. The money is coming from other countries from people that have connections with banks here along with other countries. The sell-out of Americans started 30-40 years ago and now you are seeing the results. The only thing that will pull us out of this quagmire will be productivity and FAIR trade. Example: Tariffs on autos from other countries have been slowly reduced to practically nil since 1962. For decades most countries governments protect their own except for Americans.
South Pasadena is one of those pockets, I don’t think it’s been affected at all. Funny thing is, in the last 5 yrs. lots of developers have built high-end condos all over town and most are empty. One whole bldg I know of is empty and bankrupt. Just last week a new mixed- use bldg opened.The lowest price 1/1 is around $420,000 I think, with a 2/2 around $630,000. We’ll see how well that fares!
@Jon–If taxes are too high to start a new business, may I suggest that you go to Somalia and start a new business there? Should be your dream world, because in Somalia, there are NO taxes. Let us know how your new business works out there!
By the way, in case you haven’t figured it out yet, taxes pay for EVERYTHING our government does.
Everything.
Firemen, police, jails, the military. See how dangerous it is for “small business” in Somalia with no police, jails, military, firemen, etc.
This is officially one of my favorite blogs.
I understand the housing slump. You can’t rebuild Dresden if the city while the city is still getting carpet bombed. Until it stops, the best thing we can do is wait it out and attempt to minimize our losses. And it’s going to affect everything. Intuitively, it makes sense.
Here’s the thing I don’t understand, and I’m going to be anecdotal here for a second:
Why is the company I work for (consumer goods, specialty) reporting record bookings for Spring 2011?
General sentiment is very high, and it isn’t just my company that’s up or the businesses we sell to, it’s the whole industry I work in. It’s true for retailers, manufacturers, everyone.
I fully realize that neither one brand, nor one backwater part of the consumer industry does the whole economy make, but it really is bizarre to see businesses acting as if all the doom and gloom we read everyday just doesn’t exist. Manufacturing, in general, appears to be up.
Why?
Since I bailed on buying a home earlier this year here in Silicon Valley, it seems that prices have increased, according to Zillow. I would have bought at a bottom but no.
Why are prices here in San Jose going up?
Without knowing anything more than the information in your question, I might guess that the homes being bought in an already expensive area such as that are perhaps disproportionately skewed towards those that would be bought by people who are relatively impervious to recessions. This would make the sample unrepresentative of overall conditions there.
@whitehall – simple, those areas are desirable and there are enough insane people in your state to move the market up. Don’t worry. Fundamentals stink, there’s no reason for them to move up but it’s a combination of 1) market manipulation via banks/government constricting supply 2) idiot demand from people who still want to believe. Your state is the worst for this. Even Florida is better because it’s gone through housing cycles before. I have no control over prices but I’d be pretty amazed if you didn’t get another shot with better pricing. Best case scenario for CA housing is that it mean reverts to income levels over many years. Note that there is zero chance that it won’t revert – everything does.
I’ve heard the same thing, but I don’t think they are. I have family who live in Los Gatos, and over the past 2 years they’ve had 4 houses on their street put up for sale, then taken off. I would count those houses as part of the “shadow inventory” and they’ve probably never missed a payment.
Meanwhile, my family members still think they can sell their home for what they bought it for…back in 2006.
housing has not gone down enough in the places anyone would want to live and they are not going to go down….end of story.
Only housing in the crappy areas are affordable in California…….
Just rent, save your money, retire and move to a more affordable place with wide open spaces…..and pay cash. 🙂
That might be wise counsel or another 20% drop in housing prices generally might start a cascade of sales even in some of these expensive areas. It’s one thing to wait out 2 years of price drops and not sell. It’s another to then see prices drop further and any hypothetical time of values returning to near peak recede that much further into an ambiguous future.
Or . . you could be right on the mark.
The hue and cry about jobs not coming back seems to ignore the fact that many, many of these jobs will NEVER be coming back since they were tied to RE in some tangential way.
So there should be no surprise that it wil ltake many years for these dislocations to work their way out.
I also heard today on Cheerleader Central (CNBC), that one of the …ahem…problems our economy now faces is the high rate of savings, which last month approached 6%.
How terrible for us that people (yeah – consumers, I know) are back to saving some money.
debt train about to collide with federal obligations
At least once a day someone on CNBC talks about the $1.5 trillion in corporate cash on the sidelines and how healthy business-sector balance sheets are.
That’s pure baloney. If you peruse the flow of funds, and you’ll see that corporate-sector cash assets have increased by $279 billion since the December 2007 peak, and now total $1.72 trillion. According to the same data, non-financial, corporate-sector debt has increased by $480 billion and now stands at $7.2 trillion. Corporate debt net of cash has actually increased by $200 billion during the Great Recession.
Stated differently, corporate debt net of cash was $5.3 trillion or 36.7% of GDP at December 2007 and is now $5.5 trillion or 37.6% of GDP. There’s been no de-leveraging in the business sector either — especially when its noted that tangible assets have also declined by 20% on a market basis and are flat on a book basis during the same period
Not so sure that houses won’t go down more, even in the good areas.
I don’t see any way that these prices can be sustained.
Leave a Reply