The Abyss is Deep: The Housing Abyss is Deep: 4 Major Reasons Why Housing in Southern California is Nowhere Near a Bottom.
There seems to be a crescendo rising from the Southland that we are now nearing a market bottom in real estate. The argument goes a little something like this: prices have fallen significantly, inventory is still at peak levels, and rates are still historically low that the water is now warm for any new real estate buyers. The only thing these people aren’t telling you is data alligators are waiting to snap those that jump in too early. It is incredible how only a few years ago, the inverse of this argument was used by these same people to lure people into buying. At the peak, the argument went like this: inventory is at record lows, prices go up every month, and exotic mortgage products make your monthly payment so low, that you’ll be swimming in cash when you sell your home even before the rate resets.
These folks were right during the epic housing bubble but these rules no longer apply. I know it may seem like a dreadfully long period that housing has now been going down in California but realistically prices didn’t start dwindling lower until the middle of 2007. In fact, every county in Southern California had a positive year over year median price until the third and fourth quarters of the year. I’ve already pointed out how difficult it is to use price as a predictor of future market behavior especially the median price. As long as you realize the caveats of what is going on, you can make a more informed decision. I’m not sure if you will be convinced that here in California, we have potentially a few years before we hit any market bottom. We’ve been on a surreal real estate rollercoaster that lasted 7 years; this on the back of another wild ride in the technology bubble. I can understand any reluctance people have to the current market.
In housing, market psychology also plays a key role but only to a certain point. You can’t use Jedi mind tricks to make prices go up. It is hard to capture this in raw numbers since people act irrationally especially in manias like the current real estate run up. How can we characterize the real estate market as a mania? For one, prices became disconnected from any fundamental market values. Local area rents and incomes had little reflection in the actual price of a home. Second, exotic mortgage products were mainstream and more prevalent than many had once thought. Take a look at the $163 billion in sub-prime loans looking to reset here in California over the next 12 months. Third, the prevalent belief that prices never fall and many became accustomed to expecting double-digit appreciation every year. That is how the housing market in the U.S. reached an epic value of $23 to $24 trillion only to lose $2.41 trillion in the last year.
Now maybe you’re sitting on the fence and are saying to yourself, “all this is stuff we already know, doesn’t the market currently reflect that expectation?” Yes and no. It is the case that markets such as the stock market, usually react more strongly on rumor than actual data. It is a trait of the market. Think of the futures markets in pointing to future interest rates. Yet the major difference with housing is that it is not liquid and as many are now realizing timing has everything to do with profitability especially in a bubble market. If you have any doubts about this go ahead and ask Bear Stearns how liquid their stuff was. Those that get in and out at the right moments make money. Those that stay in too long get punished. Housing no longer was a place to live but the nucleus of our entire economy. This housing downturn is so pervasive, that the media cannot talk about the economy without saying or mentioning the housing market. They are one in the same and there is no containment here.
This actually goes for the entire nation. Yet there are pocket areas that not only saw a bubble, but experienced a manic hyperbubble. Southern California is one of those places and let us now go through 4 reasons why we are nowhere close to a bottom.
Reason #1 – Distressed Properties
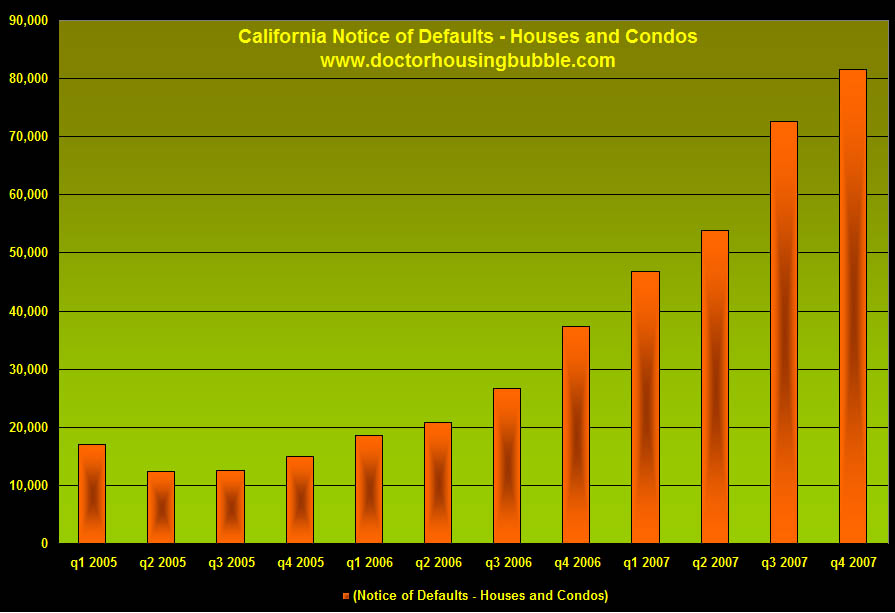
The first item that we need to look at very carefully is the amount of distressed properties hitting the market. As you can see from the above chart, notice of defaults have skyrocketed since the forth quarter of 2005. The speed in which the market has deteriorated has never been seen in California. Even in previous busts, the percent change on the downside was never so abrupt. Then again, we have never witnessed such aggressive price movement on the upside so we are in uncharted territory on both sides. DataQuick, a real estate tracking firm here in Southern California stated that last month, 33.5 percent of all resold homes were distressed properties:
“Of the homes that resold in February, about one-third, 33.5 percent, had been foreclosed on at some point since January 2007. A year earlier the figure was 3.5 percent. At the county level, the percent of homes resold in February that had been foreclosed on since January 2007 ranged from 25.3 percent in Orange County to 48.1 percent in Riverside County.”
Now you can easily make the mistake of glossing over the next sentence because the one-third amount is rather startling. But look at the number for a year earlier. Last year, distressed sales were only a tiny fraction of the entire market coming in at 3.5 percent. You’ll also notice that this number included all counties, not only one. Some had higher rates such as Riverside County and some like Orange County had smaller amounts of distressed properties (if you can call 25.3 percent a small number).
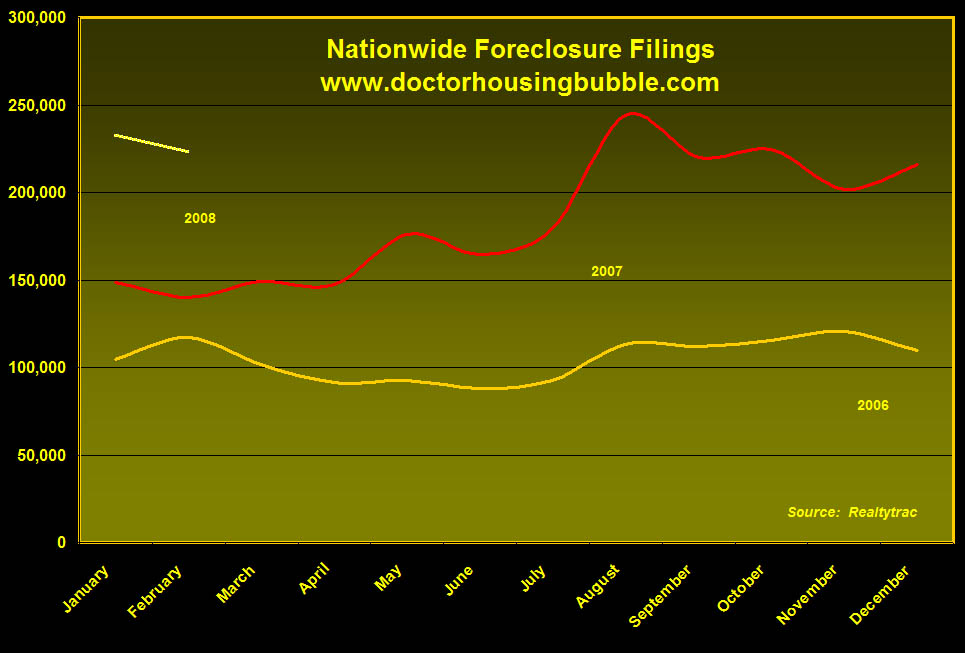
But this phenomenon isn’t confined to simply Southern California. Let us take a look at nationwide foreclosure filings:
At the current rate, we are looking at 2,700,000+ foreclosure filings in 2008. How people can be saying we are at a bottom is beyond me given the employment numbers and record amounts of inventory. Speaking of inventory let us move on to the next reason why we are far from bottoming out.
Reason #2 – Inventory and Sales
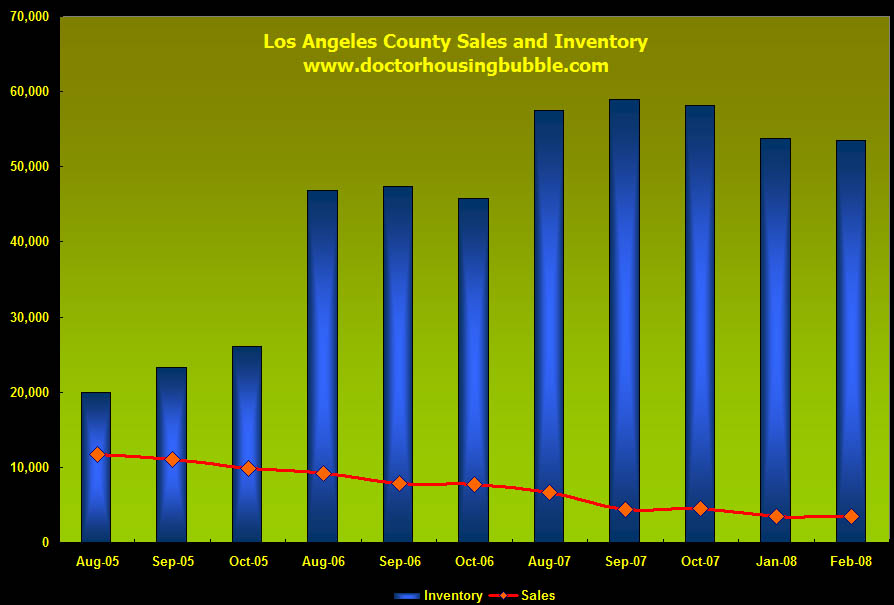
There are so many rules of thumb in the market. For example, you shouldn’t spend more than one-third of your gross income on housing. Or, a home price should not exceed 3 times your gross household income. These long held rules went completely out the window this decade. Whether you agree with the above financially conservative numbers is one matter. Another is that a healthy market, usually has 6 months of inventory on the market in any given month. How much inventory was on the market during the peak? Well if we are to look at the above chart, a peak month for Los Angeles in August of 2005, we had 1.7 months of inventory! That is an incredible figure. What that means, is that homes were exchanging so fast that inventory was being depleted at a rapid rate thus fueling price speculation. In other words, there was more demand than supply. But this demand was artificially stimulated by the lax lending and flipper nation mentality portrayed on cable housing shows.
Slowly sales started to fall from this point and obviously inventory started to grow even while prices were rising. If you look at the graph, sales started steadily declining from August of 2005. So we went from 1.7 months of housing inventory in Los Angeles to where we stand today. In a county of 10,000,000 people, we now stand at:
Inventory for Los Angeles County: 53,710
Sales from February of 2008: 3,468
Months of Inventory: 15.4 months
We are a very long way from that 6 months of a healthy market indicator yet people are saying we are at a bottom. Does the above look like a bottom to you? And we have to define a “bottom” – do we mean that we have bottomed in terms of peaking inventory? By looking at the above chart, we hit a peak in October of 2007 of 59,000 for Los Angeles County. We are slightly off from that peak. So maybe we have hit a ceiling in regards to peak inventory. Yet what does that matter if sales keep declining or move sideways? In order to get to that 6 months point, we would need to see sales jump to 8,951 per month. 3,468 is a very long way from 8,951. When most people talk about a bottom, they usually mean the lowest price point. How low can prices drop? That is the next reason why we are still miles away from a bottom.
Reason #3 – Falling Prices
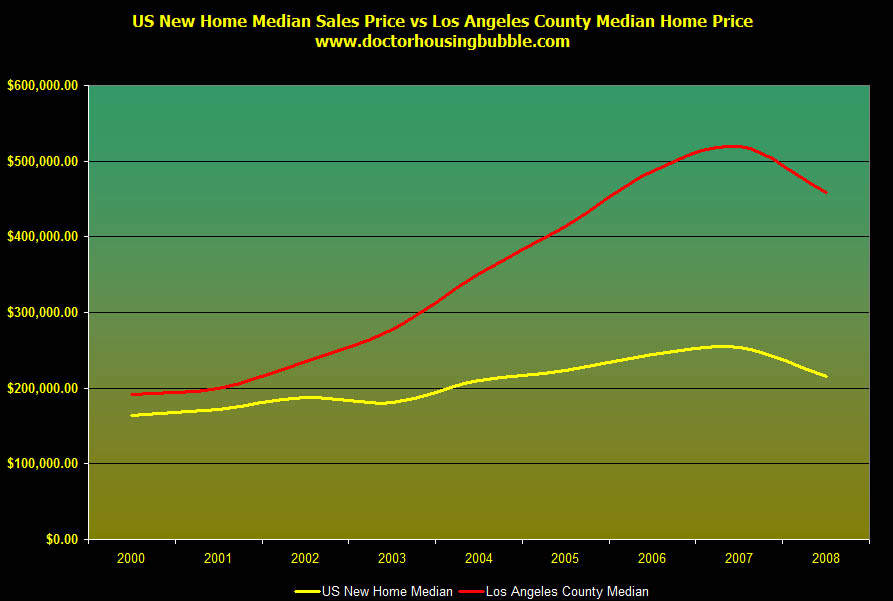
The widely used Case-Shiller Price Index showed that Los Angeles County is down, 16.5 percent on a yearly basis. This is a significant factor since the Case-Shiller Index looks at single property sales over time giving a more accurate reflection of overall market history. Yet according to the California Association or Realtors the numbers are much more grim:
“LOS ANGELES (March 24) – Home sales decreased 28.5 percent in February in California compared with the same period a year ago, while the median price of an existing home fell 26.2 percent, the CALIFORNIA ASSOCIATION OF REALTORS® (C.A.R.) reported today.”
Take a look at the universal price decline throughout the state:
| California Region | Median Price | Decline Year over Year |
| High Desert |
$220,380 |
-31.10% |
| Los Angeles |
$467,200 |
-20% |
| Monterey Region |
$619,790 |
-11.70% |
| Orange County |
$596,520 |
-13.90% |
| Sacramento |
$258,680 |
-30.90% |
| San Diego |
$450,710 |
-24.10% |
| Riverside/San Bernardino |
$289,660 |
-27.20% |
The recent DataQuick numbers for Los Angeles show a yearly price decline of 12.9 percent. So for the same timeframe and the same county, we get the following:
| Source | Price Decline |
| Case-Shiller Index | 16.5% |
| C.A.R. | 20% |
| DataQuick | 12.9% |
Bottom line is prices are falling. If we are to define a bottom as the lowest price point in the cycle does the above data actually look like the trend is anywhere near a bottom? Not only are we going to see lower prices because stuntman ninja loan products are no longer available, but there is another small issue looming on the horizon. People don’t like buying homes in a recession.
Reason #4 – Jobs
In most normal cycles, home sales decline during recessions. For some reason, this last recession earlier in the decade sparked off the biggest debt bubble the world has ever witnessed. Not only did we have the so-called “jobless” recovery but we went from one bubble to another. There are many factors for this including Alan Greenspan cutting rates to 1 percent thus encouraging people to spend instead of save, the advent of toxic mortgage products which I have chronicled in detail, and a massive societal addiction to credit (aka debt). Here is another example how things get twisted in a bubble economy. When did debt become credit? We hear that this is a credit crunch or that the Fed is trying to increase credit to the market. Wouldn’t it be better to phrase the current predicament as a debt crunch? Or a debt crisis? Because that’s what it is. In this world of public relations spin even something so obvious as debt is now called credit. In this same line of thought, we are also suppose to believe we are at a bottom while unemployment is going up?
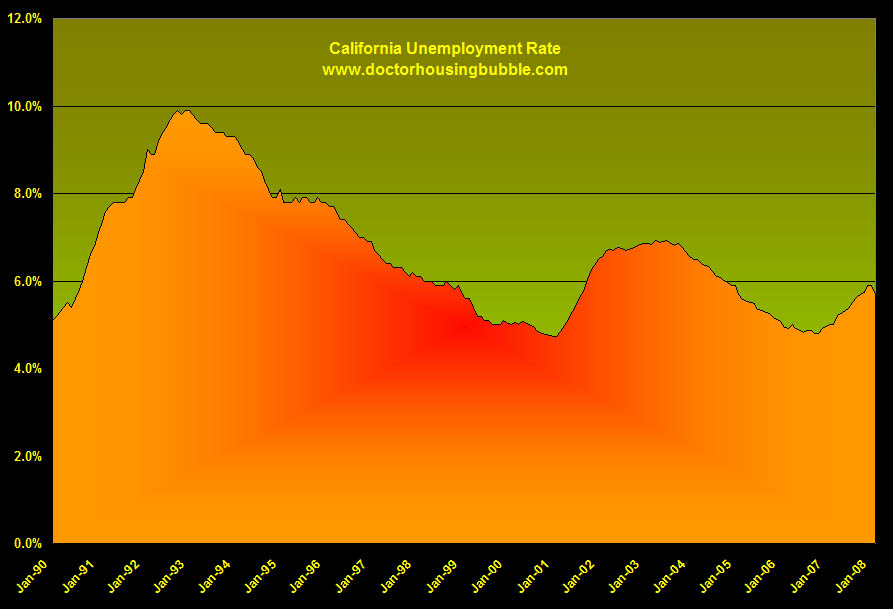
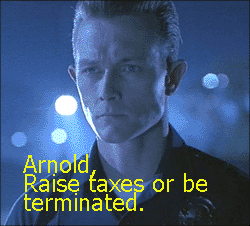
As you can see from the above chart, unemployment in California is moving upward. I examined the $14 billion budget short fall in detail here but it should be mentioned again that the state is blissfully ignoring the mounting fact that hard choices will have to be made; many which haven’t taken place. Either taxes will need to be raised in an already tax heavy state or public programs will need to be cut. You’re dammed if you do, dammed if you don’t. If you raise taxes, you’ll hurt businesses in the state. If you cut programs, you are only going to add to the unemployment lines and thus add fuel to the already increasing unemployment numbers. The Governator is facing challenges bigger than the Predator and a T-1000 combined:
What also makes the issue doubly difficult in California is so much of the job growth and tax revenue was directly connected to real estate. Construction, brokers, agents, title companies, escrow offices, home outfitters, banks, auto dealerships, and many other industries that directly and indirectly benefited from a massive housing wealth effect. It was as if the housing serpent was so hungry that it eventually devoured its own tail.
There are other reasons why we are nowhere near a bottom but these 4 reasons should put to rest any talk that we are at a market turning point here in Southern California. The trend is inevitable and the abyss is deep. What are your thoughts on the talk of a current market bottom?
 Did You Enjoy The Post? Subscribe to Dr. Housing Bubble’s Blog to get updated housing commentary, analysis, and information

 Subscribe to feed



12 Responses to “The Abyss is Deep: The Housing Abyss is Deep: 4 Major Reasons Why Housing in Southern California is Nowhere Near a Bottom.”
” I know it may seem like a dreadfully long period that housing has now been going down in California but realistically prices didn’t start dwindling lower until the middle of 2007. ”
*****They want to think the housing market slide is over because in American culture, 6 -9 months is an eternity. All that instant gratification and McD’s ‘fast food’ culture you know. The American public, as a rule. has the attention span of a gnat and zero patience and no grasp of anything long term – be it history or events in progress.
Another great post.
Point #4 is far and away the biggest factor in what is going to happen to housing here in California the next 24 months. Right now unemployment nationwide is at 5.1% and climbing, and in our last recession, fueled completely by cuts in CapEx by business, it got up to 6.2%.
But the consumer never gave up in ’01; in fact, it was the only recesion where consumer spending went up rather than down. How is that possible? Take a guess. Hosing appreciation, refis and cash outs kept the consumer going then, and that is simply not an option these days.
My guess: when (not if) unemployment gets above 6.5% you will see a sudden, sharp, dramatic correction in housing prices. As we all saw with Bear Stearns the biggest crisis any sector or comapny can face is a crisis in confidence and believe it or not there are still people out there who do not get it in housing.
But they soon will.
I have to agree with Matt that this is a great post, scary but great.
The NAR just reporting a new record low for existing home sales. How anyone can say we’re near a bottom is beyond me.
I am seeing it all over the city. Places that used to be broker and real estate offices are now taco stands. Great Points. Nothing can stop house price depreciation unless the banks come up with 60 year mortgages or bring back NINJA loans which will not happen for another 20 years. It’s just psychological
now. Sellers still think their house is worth what it was 2 years ago and are willing to leave their property on the market for as long as it takes to sell. Which could mean 20 years. I have seen properties in Downey, CA that have been up for sale for over 2 years and are still on the market.
I’ve noticed a general decline in prices for listings here in Atwater Village from the mid-600’s to mid-500’s which is still an absurd amount for these 2 bed, 1 bath cracker boxes. But just the other day a new listing popped up for 739000. Its a 3 bed, 2 bath box, but still a box (around 1200 sf) shoehorned into a very dense neighborhood with plenty of gang activity just north and south of the area. Apparently there will be a big jug of kool aid available at showings. Drink up, suckers.
“I have seen properties in Downey, CA that have been up for sale for over 2 years and are still on the market.”
Two years! Is that all? I sold my house in Florida in 2002 for $325,000. The new owner has had it on the market since 2003. I’ve watched the price go from $650,000 to $850,000 to an all time high of $929,000 in 2006. It never sold. I’m having fun now watching it on it’s way down as well. It went down to $898,000 then to $696,000 and today it is at $649,000. Zillow says it’s worth $379,000. This is so much fun : )
The securitization of non conforming loans is finished, kaput, dead. That takes a huge chunk of money for the real estate market off the table. It was only the ability of some slick hucksters to take this junk and pawn it off to investors that this thing got as far as it did but don’t expect UBS or BNP Paribas or any other foreign bank, hedge fund or sentient foreign investor to be willing to put their money in any US property derivatives for long long time. To the extent that US banks have been hurt, and they have, that too will limit their ability to finance future mortgages. Read the stories about WAMU in the financial press today. Even with a $7billion dollar cash injection it is going to have to shrink its loan activity. That’s what bad loans do to banks and not even the Fed and the GSE’s can recapitalize banks. So the money is just not there to sustain today’s housing
prices at anything like recent sales volumes. Between finding qualified buyers able to pass GSE muster and the ability of banks themselves to come up with the cash to lend getting rid of the housing overhang of both new and existing homes is going to take years not months.
In the early 1990s I saw over priced properties in Orinda (Northern California, East Bay) languish on the market for years. One vacant house sat there for over 4 years unsold. One owner pulled his place off the market , put in a new retaining wall, then relisted it for $100k more. Now he had a more expensive house that wouldn’t sell. I saw the same thing happen in the Oakland Hills. Absolute junk listed for breathtaking prices that just stood empty. I offered to rent one, but the owner declined even though he kept dropping the price and changing listing agents for years. This experience taught me a valuable lesson on just how irrational some sellers can be. I think this downturn will be more severe and I’m curious to see just how long they will hold out.
Everyday we hear that yet another Retailer has laid off people.
Yesterday it was 20 employees at the local lumber supply store.
What is frustrating is that we do not get the “real” numbers on
unemployment right now. By the time these people actually receive
unemployment and the numbers are recorded another 6 to 8 weeks
will have gone by. We are still dealing with the data as of the
last quarter of 2007. And those numbers are deceiving because
alot of Retailer add employees over the holidays to deal with the
expected holiday season. Come January 1st these people get laid off.
And the data isn’t actually apparent until almost February.
What is going on right now is really scary.
It isn’t just the jobs lost that are related to the Real Estate Market
but goes way deeper. Now it affects all classes of Retail and
manufacturing. We simply no longer have the sales that are considered
“normal”.
The price of gasoline is sky high.
The refineries are cutting back production because they can’t make
the margin… in other words it is not profitable enough to produce
a high inventory of gasoline right now, so let’s just cut back and
charge an arm and a leg to the gas stations which in turn have
to keep raising the price of gas so they hopefully can pay for the
next tanker load that is scheduled to arrive.
At the same time the Credit Card Fees that are charged to the
merchants is eating up the profits. When monthly credit card fees
are reaching the same level as your monthly payroll you are getting
very tempted to switch to cash only.
But in this day and age over 80% of your business is done in Credit Cards.
The spread between Debit Transactions and Credit Transactions is
4 to 1 in favor of credit. That alone tells you that we Americans have a
problem. It used to be that you would think twice to swipe your credit card
to buy a cup of coffee or a snack. Not anymore…
The price for a barrell of oil keeps going up and up.
I just wonder whether the fact that a very important person in Abu Dhabi
just put 7.2 billion dollars into Citicorp (MasterCard), so that his recent
investment wouldn’t go belly up, has something to do with it…
After all Abu Dhabi is one of the top oil producers…
I am sure that his “Highness” isn’t too upset that the barrell price
keeps going up and up. The SOB is probably pushing it up there
himself to get his money back.
Yes, everything is interconnected and no, the Real Estate Market
has not found it’s bottom yet.
Wishfull thinking and blatant lies about the state of the Economy
and the future will not change the hard facts.
Jobs are being lost, wages are not keeping up with inflation and
the average American carries such a high balance of credit card debt
that there isn’t enough money left anymore after you pay fo gas.
This is all amazing!! When will it end? 10 years from now, 20?
My mini-ranch sold for 860,000 to a friend in 2006, then he backed out of the deal. I Put it up for sale again as I was poring money into it so I could make it a million dollar house as I listen to all the Realtors that wanted to list it on the market.. Was offered 900,000 for it from another friend and went through another 5months for the sale to go through. Then they backed out and couldn’t buy it. I put it up for sale again and then lost the market. The money I put into the house of over $70.000 I have lost along with all the payments each month. So we had to stop paying on our loan seven months ago. We are trying to sale our house by short pay. So in 2006 I almost had a sale of $900,000 dollars offer down to $499.000 dollars in 2008. My loan on the house is now over $840.000 . I’m just hoping our new offer of $499,000 the bank well take and not come after us for the difference. This makes me sick just to think about it.
Leave a Reply